Artemis SmartGARP UK Equity Fund update
Philip Wolstencroft, manager of the Artemis SmartGARP UK Equity Fund, reports on the fund over the quarter to 30 September 2023 and the outlook.
Lower valuations + higher growth = outperformance
Our fund is performing well versus its benchmark. Helped by its relatively high exposure to stocks trading on below-average valuations, it returned 2.5% over the quarter, outperforming the FTSE All-Share index (which added 1.9%). Admittedly, after a good run in 2021-22, it is slightly behind the index over the year to date. Over past three years, however, it has returned 69.6% versus 39.8% from the index. In the grand scheme of things, the fund is close to its relative highs.
I could list our winners and losers over the past quarter (or, for that matter, over the year to date) but in reality, the contribution from each individual holding has been modest. It is more useful to focus on the big picture: the performance of our fund and of our competitors (both active and passive) against the FTSE All-Share index.
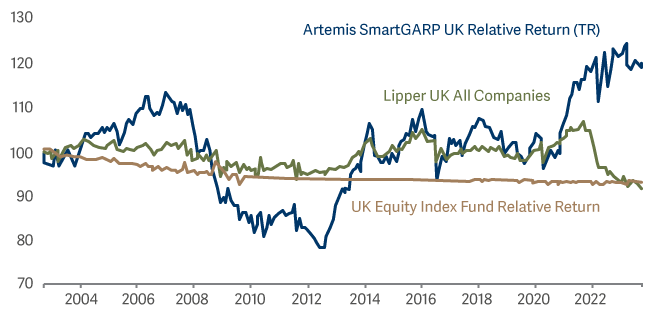
Since 2002, the fund has outperformed the index, passive UK index funds and most active UK equity funds. Over the past few years, investors have pulled money out of active equity funds. Their rationale is obvious: active funds (shown by the green line in our chart) have underperformed their benchmark. As a result, cheaper index tracker funds have won market share despite also outperforming (as the gradual slope downwards in the black line shows). Clearly, if active equity funds are to survive, they must deliver better returns than index funds. As the red line shows, our fund has done that – outperforming active funds, passive funds and the index. But it is probably helpful to understand why we think we have outperformed.
Just as a stock that has a better-than-average combination of income and growth should beat the market, so should a fund whose portfolio exhibits those characteristics. The table shows some of the fund’s key characteristics relative to the UK market.
| 12-month forward P/E | 12 month forward dividend yield | 12-month forward return on equity | Payout ratio | |
|---|---|---|---|---|
| Fund | 6.3% | 5.6% | 16.9% | 35% |
| Benchmark | 10.3% | 4.5% | 14.6% | 46% |
| Relative | -39% | +21% | +2.3% | -24% |
Our holdings are more profitable, cheaper and pay higher dividends than the average company in the UK market.
Our portfolio undoubtedly has a higher level of income than the market. At 5.6%, the dividend yield on our portfolio is 1.1 percentage points higher than the FTSE All-Share (4.5%). That implies that investors expect our companies to grow by about 1 percentage points per annum less than the wider market in perpetuity. This is not a huge difference but our companies are more profitable than the average company in the UK market (they have a higher return on equity) and their dividends represent a smaller percentage of their earnings (our fund’s payout ratio is lower). On balance, then, we believe the prospects for our holdings look slightly more positive than those of the average company.
What makes our companies really exciting to us, however, is the newsflow: our companies have been seeing their profit forecasts increasing. Earnings revisions are typically a good predictor of future growth – which is why SmartGARP looks for them. Over the last six months, earnings per share forecasts for the UK market in 2024 have fallen by about 3%. Forecasts for our companies earnings per share, however, have risen by around 1%. This gives us confidence that our companies will, in fact, outgrow the market.
Moreover, we have two decades of evidence that our system correctly identifies companies that subsequently outgrow the market. The combination of dividend yield plus actual growth in ‘fundamental value per share’ (a mix of various measures of corporate success such as profits, cashflows and dividends per share) for our fund and the market is illustrated below:
Annualised growth in FVPS
| One year | Three years | Five years | 10 years | Since inception | |
|---|---|---|---|---|---|
| Fund | -1%% | 24% | 13% | 14% | 11% |
| Benchmark | 2% | 16% | 7% | 7% | 8% |
| Difference | -3% | 7% | 6% | 7% | 3% |
Over the longer term – since Artemis began managing the fund in 2002 – the market has seen its FVPS grow by about 8%. Our fund, however, has seen FVPS compounding at nearer 11%. This is the reason why the fund has outperformed.
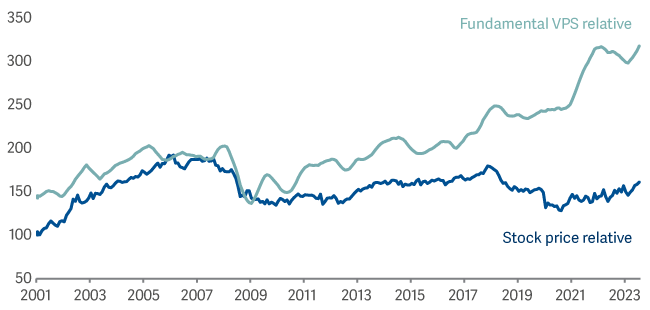
Note: Fundamental value-per-share (FVPS) is a combined measure of earnings, cashflow, operating profits, dividends and asset value per share
None of us know what the future holds. Our outperformance, of course, will only last if we can continue to find companies that outgrow the market. But what we can say with confidence is that we have a process that has worked for more than two decades. We think that process gives us an edge because it is objective – it rewards actual growth, rather than the promise of growth. Investors are not automatons, but emotional human beings. That means they have a habit of chasing dreams rather than doing simple things well, year in, year out. I believe that if we stick to our process – and stick to doing simple things well – then our fund has a good future ahead of it.
Source: Lipper Limited/Artemis from 31 March to 30 September 2023 for class I accumulation GBP.
All figures show total returns with dividends and/or income reinvested, net of all charges.
Performance does not take account of any costs incurred when investors buy or sell the fund.
Returns may vary as a result of currency fluctuations if the investor's currency is different to that of the class.
Classes may have charges or a hedging approach different from those in the IA sector benchmark.
Benchmarks: FTSE All-Share Index TR; A widely-used indicator of the performance of the UK stockmarket, in which the fund invests. IA UK All Companies NR; A group of other asset managers’ funds that invest in similar asset types as this fund, collated by the Investment Association. These act as ‘comparator benchmarks’ against which the fund’s performance can be compared. Management of the fund is not restricted by these benchmarks.