Artemis SmartGARP UK Equity Fund update
Philip Wolstencroft, manager of the Artemis SmartGARP UK Equity Fund, reports on the fund over the quarter to 31 March 2024 and the outlook.
Source for all information: Artemis as at 31 March 2024 unless otherwise stated.
The fund had a good quarter – up 10.3% at a time when the FTSE All-Share rose by 3.6% and the average UK equity fund rose by 2.8%. Indeed, relative to the benchmark, the fund is at all-time highs.
As a reminder, our fund has a higher value exposure than about 97%1 of UK equity funds and value stocks generally underperformed the market in Q1. This was not so much because value stocks had poor growth but rather with the Nasdaq hitting new highs and Bitcoin rising by 60%, investors were excited about life in general and in no mood to own boring and low-priced stocks.
Helped by upgrades to earnings
Fortunately, while we had a high value exposure, we also had high exposure to other things that were working – namely stocks with positive profit surprises. Over the past quarter, most companies reported their 2023 profit results and our companies generally had good numbers and analysts subsequently raised their 2024 profit forecasts. Notable winners in the portfolio included the likes of Bank of Georgia, Unicredit, Beazley, 4imprint and GlaxoSmithKline.
Rather than give you any more detail on what went right or wrong I will leave you with a table and commentary illustrating the aggregate financial characteristics of the holdings in our fund:
| Indicator | Fund | Market | Gap | ||
|---|---|---|---|---|---|
| 1 | Forecast return on equity, cashflow return on capital/assets | 9% | 10% | -1% | Slightly lower 'quality' |
| 2 | Historic earnings yield (EY) | 11.2% | 7.5% | +3.7% | But higher EY |
| 3 | Prospective EY | 13.4% | 8.8% | +4.6% | And faster growth |
| 4 | 3m % change EPS forecasts | 4.2% | 0.8% | +3.4% | But forecasts look more believable than the market |
| 5 | 1 year % change number of shares | -2.5% | -1.2% | -1.3% | Buying in shares |
| 6 | Historic Dividend Yield (DY) | 3.9% | 2.9% | +1.0% | Paying out dividends |
| 7 | Prospective DY | 4.5% | 4.0% | +0.5% | And increasing them |
| 8 | Forecast Debt/EBITDA | 0.6x | 1.5x | -0.9x | And paying down debt |
If our fund were a stock, you would buy it…
Our stocks would appear to have slightly lower return on capital type measures than the market (row 1). In market parlance, investors would regard them as lower-quality businesses and this ought to mean lower future growth.
To a large extent, this is compensated by having a much higher historic earnings yield (and therefore low price earnings ratio) (row 2). In the long run, future investment returns are primarily a function of the valuation you buy the stocks on rather than the current return on capital (because return on capital and valuations tends to mean revert).
Nevertheless, some would regard a high earnings yield today as being a forerunner to lower profits in future. However, if anything the EY gap is forecast to increase going forward (implying faster growth for our stocks) (row 3).
In the meantime, the EPS forecasts for our stocks have risen sharply compared to the benchmark (row 4). This gives us some degree of comfort that we are on the right track.
The management of our companies seem to agree because they are buying in shares (row 5), paying out large (row 6) and rising (row 7) dividends and – since cashflows are so prodigious – debt/ebitda (row 8) is forecast to be substantially lower than the market (which would suggest they are in fact lower risk).
When you imagine buying a stock to own and keep, these are precisely the kind of characteristics you would be looking for.
What we are doing today with the portfolio is largely what we have been doing for the past 20 years. The difference is that the valuations at which we can buy stocks at are more attractive than they have been in the past. What has not changed is our focus on stocks with upgrades to profit forecasts. This is a much ignored but important factor for us. The reason is that rising EPS forecasts are a signal that the company is in fact growing faster than had been anticipated. The result is that we have tended to own stocks that subsequently outgrow the market:
The fund's relative price performance compared to its value per share
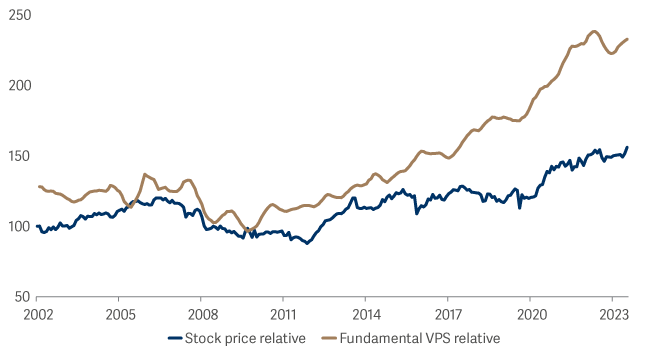
Note: value per share (VPS) is a combined measure of earnings, cash flow, operating profits, dividends and asset value per share
This is why, over time, the fundamental value per share of our fund (pre fees) has had a knack of rising by about 3% pa faster than the benchmark. This, I believe, is a genuine marker of the alpha our process generates.
The fund has lagged this 3% growth rate by about 1% pa and so I think historic fund returns have been below 'normal'. To me this is a signal that future returns will be above 'normal'. When this happens is anyone’s guess, but the recent trends have certainly been helpful and it seems investors are coming to our way of thinking.
Source: Lipper Limited/Artemis from 31 December 2023 to 31 March 2024 for class I accumulation GBP.
All figures show total returns with dividends and/or income reinvested, net of all charges.
Performance does not take account of any costs incurred when investors buy or sell the fund.
Returns may vary as a result of currency fluctuations if the investor's currency is different to that of the class.
Classes may have charges or a hedging approach different from those in the IA sector benchmark.
Benchmarks: FTSE All-Share Index TR; A widely-used indicator of the performance of the UK stockmarket, in which the fund invests. IA UK All Companies NR; A group of other asset managers’ funds that invest in similar asset types as this fund, collated by the Investment Association. These act as ‘comparator benchmarks’ against which the fund’s performance can be compared. Management of the fund is not restricted by these benchmarks.