Artemis Global Income Fund update
Jacob de Tusch-Lec and James Davidson, managers of the Artemis Global Income Fund, report on the fund over the quarter to 30 September 2024 and their views on the outlook.
Source for all information: Artemis as at 30 September 2024, unless otherwise stated.
There was no shortage of noise in the third quarter:
- A snap election in France saw various forms of political populists making gains.
- There were two attempts to assassinate former President Trump.
- Some data suggested that the US economy was slowing; some data suggested that it wasn’t.
- Interest rates went down in the US and in the UK but went up in Japan.
- There was a short, sharp sell-off in early August (one that been entirely erased by the time the quarter ended).
- China announced a new package of fiscal and monetary stimulus measures.
After sifting through all this, we believe the salient points are that:
- The US economy appears to be in good shape. Employment remains strong, and consumers have continued to spend. The wider global economy also looks reasonably healthy.
- A ‘soft landing’ looks increasingly likely. The Fed’s bold decision to cut rates by 50 basis points in September (perhaps an ‘emergency’ cut without the emergency) combined with stimulus in China could provide a powerful boost to demand.
- The outlook for equity markets looks constructive. Interest rates are falling. And while they may not fall as far or as quickly as the market hopes, some of the capital sitting in money market funds may start to flow back into equities.
In the market, meanwhile, the headline return of 0.5% from the MSCI AC World Index over the quarter masked some interesting developments beneath the surface.
- ‘Value’ significantly outperformed ‘growth’ as a style.
- Markets appeared to be broadening out. The longstanding hegemony of US technology stocks was challenged again. Microsoft’s share price tested its 12-month relative lows and we saw a significant selloff in semiconductor stocks.
- Chinese equities posted their strongest week of returns since 2008, rallying by more than 25% in one week.
Performance
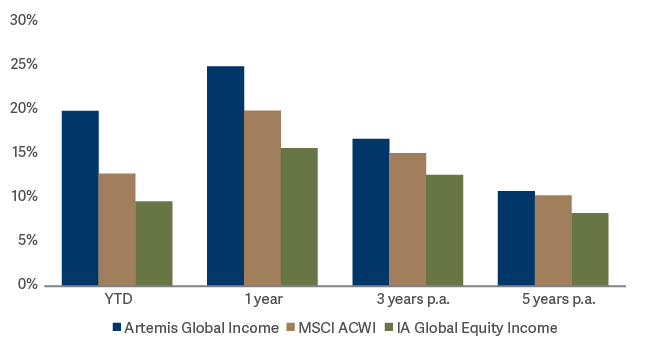
The Artemis Global Income Fund returned 1.3% over the quarter, outperforming the benchmark MSCI AC World Index, which returned 0.5%. The fund’s recent performance puts it in the top quartile of the IA Global Equity Income sector over the year to date. It is also top quartile over one, three and five years.
This outperformance has been delivered despite the fund’s consistently large underweight to mega-cap technology companies which, despite their recent wobble, have driven returns from equity markets over most recent timeframes.
| Q3 2024 | Year to date | One year | Three years | Five years | |
|---|---|---|---|---|---|
| Artemis Global Income Fund | 1.3% | 19.9% | 24.9% | 38.3% | 66.8% |
| MSCI AC World | 0.5% | 12.8% | 19.9% | 26.9% | 63.3% |
| IA Global Equity Income | 2.4% | 9.6% | 15.7% | 26.0% | 48.9% |
Contributors
| Return | Contribution | |
|---|---|---|
| Mitsubishi Heavy | 30.2% | 1.13 |
| Newmont Corp | 20.1% | 0.46 |
| Commerzbank | 13.6% | 0.44 |
| Tesco | 16.5% | 0.43 |
| Siemens Energy | 26.6% | 0.42 |
The fund’s significant underweight to technology stocks made a positive contribution
The technology sector now accounts for 25% of the MSCI AC World Index. Reflecting the lack of meaningful dividends across much of the sector, our portfolio has just 5% allocated here. Our underweights to semiconductor and software stocks were particularly helpful over the third quarter.
Our defence holdings continued to perform well
Sadly, a number of conflicts appear to be becoming entrenched. The bitter conflict in the Middle East is intensifying rather cooling. There is no sign that Russia’s war on Ukraine is about to end. China’s war of words with Taiwan continues. Almost three decades of complacency following the Cold War mean most Western governments are underprepared for this new era of warfare: stockpiles of ammunition are almost non-existent and there is little capacity to ramp up production.
This scarcity has transformed the pricing power of the world’s defence companies. In many cases, their order books are full for a number of years. The fund’s holdings in the sector currently include:
- Mitsubishi Heavy Industries (Japan)
- Hanwha Aerospace (South Korea)
- BAE Systems (UK)
- Embraer (Brazil)
- Rheinmetall (Germany)
- Lockheed Martin (US)
Collectively, these holdings amount to 11% of the portfolio.
Companies that can help the world meet its evolving energy needs performed well
The energy transition and the rapid growth of energy-intensive AI applications and data centres is helping to transform the world’s energy systems. Investors are beginning to recognise the role that two of our holdings are likely to play in that transformation:
Mitsubishi Heavy Industries builds nuclear power plants and is the world leader in gas turbine power stations.
Siemens Energy is a market leader across a wide range of energy technology and grid applications.
We struggle to see a decarbonised energy grid in which nuclear power doesn’t feature heavily. So we were interested to learn of Microsoft’s deal to restart the nuclear reactor on Three Mile Island to supply power to one of its power-hungry data centres. Around 70 new nuclear reactors are currently under construction worldwide, with another 300 planned or proposed. A sharp rally in the share price of uranium miner Cameco towards the end of the quarter reflected the growing recognition that we are in a new era for nuclear energy.
Our banks continue to generate attractive returns
Commerzbank was a significant contributor to returns over the quarter. Its larger Italian peer UniCredit bought the entirety of a 4.5% placing in its shares from the German government. UniCredit has since increased its stake to more than 20%, fuelling speculation that a takeover approach may be imminent. The German government has thus far opposed any potential acquisition, but consolidation within the European banking industry has long been anticipated.
UniCredit’s actions seemed timely given the release of the so-called Draghi Report, a paper written by the former ECB chief suggesting strategies to help Europe improve its competitiveness and close the gap to the US in a number of critical industries. If UniCredit does acquire Commerzbank, it could trigger a wave of consolidation across Europe. European banks remain a significant (10%) overweight in our portfolio, reflecting their attractive valuations and cash returns through dividends and buybacks. We are currently thinking about how else this theme might play out.
Detractors
| Return | Contribution | |
|---|---|---|
| Samsung Electronics | -24.9% | -0.71 |
| Intel | -42.6% | -0.43 |
| Var Energy | -15.5% | -0.33 |
| Hyndai Motor | -18.1% | -0.32 |
| General Motors | -9.8% | -0.19 |
Samsung was one of our weakest performers
Analysts continued to lower their earnings forecasts for Samsung due to a combination of higher costs (thanks in part to a significant one-off employee bonus payment), weak demand for smartphones and significant supply from Chinese manufacturers of memory chips.
Over the longer term, Samsung should be well placed to benefit from growing demand for its high-bandwidth memory chips, which are important components in AI datacentres. Moreover, its shares look cheap relative to those of its peers and relative to their own history. In the short term, however, the stock lacks a catalyst for re-rating and, as such, we sold the holding.
While our exposure to automakers was unhelpful, we retain our positions in GM and Hyundai
The autos sector has recently endured a slew of profit warnings amid concerns around increased supply of cheap vehicles from China. We retain the holdings in GM and Hyundai.
General Motors’ shares trade on forward price-to-earnings multiple of just 5x and generate a 20% free cashflow yield. To us, this suggests the company could increase share buybacks or return cash directly to its shareholders. Moreover, because a significant proportion of the vehicles GM sells are bought on finance, it is also a potential beneficiary of cuts in interest rates.
Hyundai’s shares trade on forward price-to-earnings multiple of just 5x and on a price-to-book multiple of 0.5x. As such, it could benefit from initiatives by the South Korean regulator to close the ‘Korea discount’ and boost valuation multiples. These echo some of the reforms Japan has successfully implemented in recent years. We would also note signs that the initial public offering of Hyundai’s Indian business appears to be seeing strong investor demand.
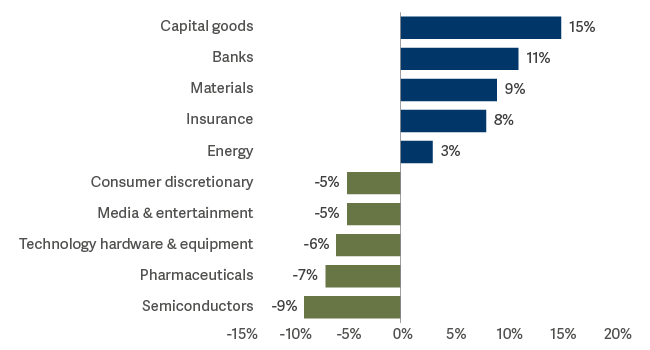
Activity and positioning
Active sector allocation vs MSCI AC World Index
| Top Five Overweight Stocks | Fund | MSCI ACWI |
|---|---|---|
| Mitsubishi Heavy | 4.44% | 0.06% |
| Commerzbank | 3.86% | 0.02% |
| Oracle | 3.96% | 0.36% |
| Kinross Gold | 2.73% | 0.01% |
| Siemens Energy | 2.74% | 0.03% |
| Top Five Underweight Stocks |
Return | Contribution |
|---|---|---|
| Apple | 0.00% | 4.34% |
| Microsoft | 0.00% | 3.88% |
| Nvidla | 0.00% | 3.82% |
| Alphabet | 0.00% | 2.33% |
| Amazon | 0.00% | 2.23% |
We increased our exposure to beneficiaries of Chinese stimulus
There have been several false dawns in China in recent years but the latest round of stimulus made it prudent to increase our exposure to beneficiaries of stronger demand. We therefore added to the portfolio’s holdings in miners, insurers and some domestic consumer names.
Some of the capital we invested here came through a reduction in the fund’s exposure to Japan. Japanese and Chinese equities often pull in opposite directions. The fund’s holdings in Japan have been strong performers for us in recent years so we were happy to lock in some profits.
We have added to our ‘risk’ and ‘growth’ buckets and reduced our allocation to its ‘core’.
We group the fund’s holdings into three buckets:
- Risk – Companies with a high (opportunistic) dividend yield, high beta, high financial gearing and usually with a significant value bias.
- Growth – Companies with above-market dividend yields and dividend growth, with average payout ratios. These are often cyclical stocks.
- Core – Mature companies with high and stable dividend yields and high payout ratios but low dividend growth.
In the early part of the quarter, we added to defensives, which tend to be found in the core bucket, due to our concerns around slowing growth. But a subsequent 50-basis-point rate cut in the US and significant stimulus measures in China could provide a significant boost to the global economy and, in turn, for equity markets. So, towards the end of the quarter, we took our allocation to the fund’s ‘risk’ and ‘growth’ buckets back up again. At 21%, our allocation to ‘core’ income stocks remains significantly below the average of 39% since the fund’s launch.
Outlook
We are aware that we have seen a number of false dawns in China before and that any number of potential macroeconomic shocks could be waiting around the corner. For example, at the time of writing in mid-October, the oil price has gained 10% over the month to date due to the conflict in the Middle East. At the same time, however, the outlook for equity markets appears to be clearly positive:
- While there were some signs of normalising (slowing) economic growth in the US over the summer, there was nothing that suggested a deep recession was imminent.
- Employment and wage growth have remained strong, and a jobs report that significantly exceeded forecasts (non-farm payrolls increased by 254,000 in September, the largest increase for six months) suggested this is likely to continue.
- A 50-basis-point rate cut from the Fed combined with China’s most concerted effort in several years to reignite the economy represents a significant level of stimulus.
After a period of being slightly more defensive over the summer, the fund’s positioning has reverted to where it was in the spring, albeit with more exposure to China and less to Japan. The fund now has more exposure to cyclical assets that benefit from a stronger global economy and increased capital expenditure.
Our portfolio continues to trade on a significant valuation discount to the wider global market. Its average price-to-earnings multiple is 14x versus 24x for the MSCI AC World Index. It also offers a higher yield, with a dividend yield of 4% versus 2% for the MSCI AC World Index. At the same time, however, our stocks are delivering comparable earnings growth and dividend growth to the wider market, with median earnings per share growth of 11% for our portfolio (versus 10% for the index) and a median dividend per share growth of 6% for our portfolio (versus 7% for the index).