Artemis SmartGARP European Equity Fund update
Philip Wolstencroft, manager of the Artemis SmartGARP European Equity Fund, reports on the fund over the quarter to 30 September 2024 and the outlook.
Source for all information: Artemis as at 30 September 2024, unless otherwise stated.
- Fund treads water after a strong previous year.
- We believe European equities offer low risk and the potential for high returns.
- The fund is biased towards European value stocks.
| Three months | Six months | One year | Three years | Five years | |
|---|---|---|---|---|---|
| Artemis SmartGARP European Equity Fund | 0.1% | 2.1% | 18.5% | 36.1% | 57.8% |
| FTSE World Europe ex UK | 0.0% | 0.3% | 15.3% | 21.2% | 48.4% |
| IA Europe excluding UK Average | 0.1% | -0.3% | 14.3% | 12.9% | 43.1% |
The market and fund ended the quarter unchanged over the quarter with a return of 0.0% in sterling terms. Nevertheless, over the past one, three, five years and since inception, the fund is substantially ahead of the index.
Despite ending the period at the same level, markets went through considerable volatility. There was a mini panic attack in August when fears of a US slowdown took hold. In September, investors got positively excited by easier monetary and fiscal policy in China.
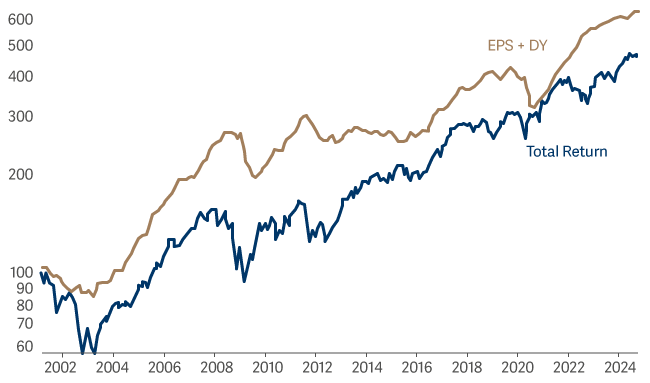
Ultimately, equity returns are driven not by sentiment but by the combination of income and growth (see Chart 1). Over the past 23 and a half years (since we launched this fund), European fundamentals1 have grown by 8.1% per annum while equity markets have returned 6.7% per annum. Returns lagged fundamentals because markets started off very expensive (a prospective price/earnings ratio of 18x) and ended up normally valued (14x). Over time we would expect returns to largely mimic the trend in income plus growth.
For the moment, markets appear to be priced about right, and growth continues to chug along. As such there are no obvious warning signs that European equities are dramatically exposed nor about to embark on a major bull market. That is not to say it cannot happen, but rather to say we should probably focus on the nuts and bolts of running money rather than forecasting major shifts.
MSCI Europe ex UK
Over the same period, our fund has seen its fundamentals grow by about 10% and returned 7.8% (net of fees) per annum. Basically, we have delivered higher returns because we ended up owning companies that grew 2% per annum faster than the market. This 2% gap does not seem huge, but it is a significant amount of 'alpha' over that time.
When we launched the fund in 2001, markets were expensive and investors were crowded into overpriced technology stocks (sounds familiar?). It turned out that owning dull but undervalued companies was less risky and more profitable than owning the market. My sense is that the next few years may well be similar to that of the 2001-2003 period.
The major difference of now vs. then is that while most US stocks are 'expensive' and US growth stocks 'very expensive', markets outside the US are 'normally priced' and value stocks outside the US are 'abnormally cheap'.
It is not clear what markets will do over the next few years, but our portfolio should be capable of outperforming the benchmark. The fund's aggregate price/earnings ratio is about half the market's, our companies are buying back their shares, debt levels are low, and profit forecasts are going up. This is a good starting point.
While the overall structure of the fund is largely unchanged from a few months ago, the holdings do shift. Over the past few months, we have raised our exposure to the pharmaceutical sector by buying Teva, Novartis and Roche. We have also bought other fairly economically insensitive stocks such as Lottomatica (Italian lottery), ACS (toll roads), Engie (French electric utility) and Essity (consumer paper products). Making way for this we sold holdings in various cyclical and oil stocks such as Heidelberg Materials (cement), Repsol (oil), Stellantis and Renault (autos).
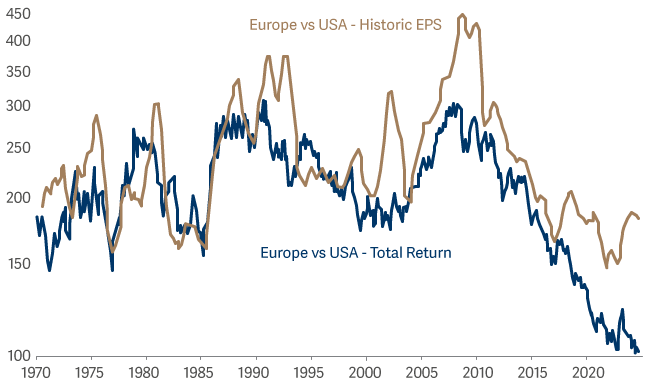
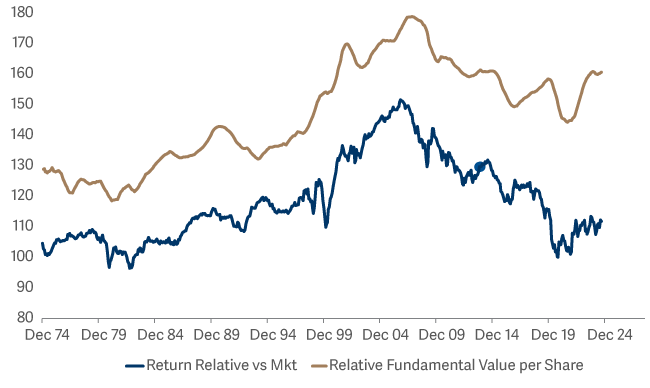
The following two charts illustrate two of the more extreme features of financial markets right now. Chart 2 shows that European equities are very undervalued vs USA – especially since earnings growth is similar. Likewise, Chart 3 shows that within Europe, lowly priced (value) stocks are abnormally cheap and growing.
European equities compared to the US
European value stocks
What will be the catalyst for change? Who knows… What I do believe is that investing is about doing sensible things in a diligent fashion. For long periods it might seem pointless, but over the years it makes a big difference. Having exposure to European value stocks at this juncture seems like a relatively low risk/high return strategy.