Rate cuts: History suggests this is a good time to buy bonds
Previous rate-cutting cycles have seen the Bank of England pushing interest rates significantly lower than investors initially expected. If that pattern is repeated this year, it would offer powerful support to bond prices.
When the Bank of England finally cut rates back in early August, it was a knife-edge decision, with the monetary policy committee voting in favour of cutting rates by just five votes to four. In the press conference that followed, Governor Bailey pushed back against expectations that another cut would follow at its next meeting, emphasising that the Bank was not on a preset easing course. He was right: a clear majority voted for rates to remain on hold at the MPC’s September meeting.
This made sense, as measures of core inflation have been stickier than headline readings, and wages are still above levels consistent with the Bank’s inflation target. Yet, despite this guidance, markets are priced in anticipation of a further 150 basis points (1.5%) of cuts over the next 12 months.1 So, who are we to believe – the market? Or the Bank of England?
One way to explain this discrepancy is to look back at previous rate-cutting cycles. I looked at four major rate-cutting cycles – in 1990, 1998, 2001 and 2008 – and compared what markets thought would happen with what actually happened. The gap between expectations and reality might surprise you.
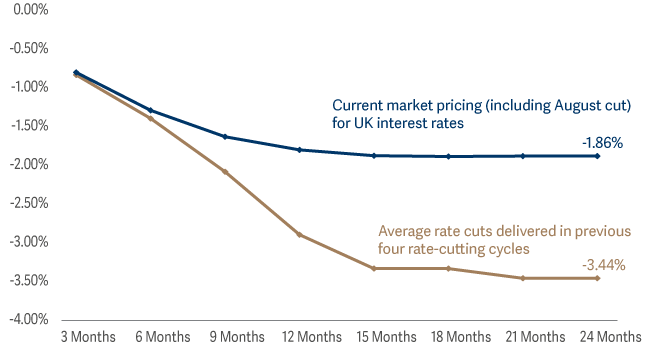
In previous rate-cutting cycles, borrowing costs fell by more than the market currently expects.
In all four instances, rates fell further than markets expect to see this time. Even in the shallowest cutting cycle (2001) rates fell by 2% within 18 months.2 And during rate-cutting cycles that extended beyond a year, rates fell by 4% on average.3
This raises an important question: did investors at the time expect the Bank to cut by as much as it subsequently did? This is where things get interesting. You might say “all cycles are different, and 2024 doesn’t look like 1990 or 2008”. That’s entirely fair. But I find it striking that, on all four occasions, the market underestimated how far rates would fall.
The market has a poor record of predicting the extent of interest-rate cuts
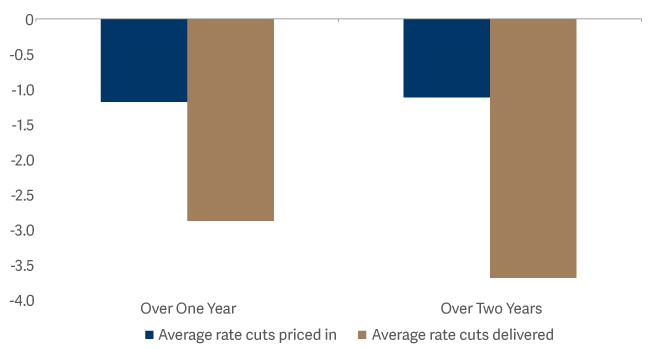
On average, just before the Bank began easing, the market was pricing in cuts of just more 1% over the next 12 months. In the event, however, rates were actually cut by an average of 2.75%.4
Not surprisingly, markets were even worse at predicting how far rates would fall on a two-year horizon. Again, they expected rate cuts of just over 1%. But, on average, cuts of just over 3.5% followed.5 In 2001, the forecast was for rates to rise marginally on a two-year view. They actually fell by 2%.6
What are we to conclude from this? Even after the first cut by the Bank of England and the subsequent moves by markets to price in further cuts, we’re still only pricing in a relatively shallow cutting cycle. My interpretation is that we should still expect rates to come down by more than markets are predicting, bringing down savings rates and pushing bond prices higher.
Path for UK rate cuts as currently priced in by markets versus rate cuts delivered over the last four rate-cutting cycles
Why the Bank may need to cut rates by more than the market expects
Why might policymakers need to cut rates more aggressively than is currently being priced in? The pessimistic view is that what currently looks like a ‘soft landing’ could turn into something much less comfortable. Unless central bankers have become much better at gathering and processing market data, past experience suggests that rates will be lowered too slowly. (And not just in the UK – the US Federal Reserve faced criticism that it had been too slow to respond to signs of weakness and so delivered a 50-basis-point cut.)
To be clear: I am not blaming the central bankers for this. Fine-tuning monetary policy is an incredibly difficult task. Policymakers mostly rely on historical data. It is like driving a car while looking in the rear-view mirror. Monetary policy, meanwhile, acts with a lag. That can mean the signal to change direction arrives too late and the moment to start gently turning the wheel has already passed.
Investors can prepare for rate cuts by locking in today’s attractive yields
Today, the top five-year fixed-rate cash savings account is paying about 4.3%. You can get about 4.5% over three years.7 Short-duration investment-grade bonds, however, offer a higher starting yield of around 5.1%. Even if rates do not tumble, that looks attractive. Furthermore, if interest rates do fall by more than expected, capital gains enhance your total return.
I’m a bond investor, rather than a historian. But my interpretation of the recent history of monetary policy in the UK suggests that bonds of all varieties may be an attractive buy at the moment, with short-duration investment-grade bonds looking particularly attractive. Market history doesn’t repeat itself – but it often rhymes.
7 Source: MoneySavingExpert, as at 26 September 2024