Artemis SmartGARP UK Equity Fund update
Philip Wolstencroft, manager of the Artemis SmartGARP UK Equity Fund, reports on the fund over the quarter to 31 December 2024.
Source for all information: Artemis as at 31 December 2024, unless otherwise stated.
Fund objective
The fund’s objective is to seek long-term capital growth by investing in attractively-valued companies whose earnings are growing, mainly in the UK.
Summary
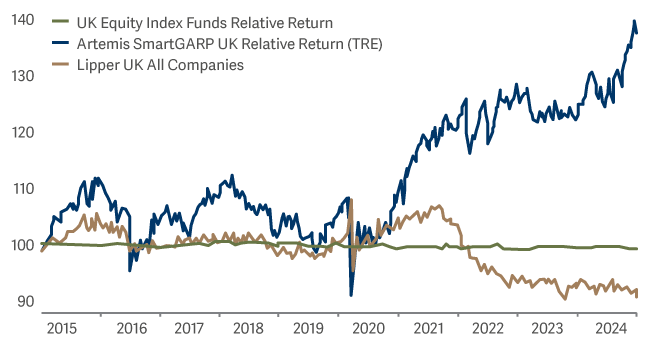
The SmartGarp UK Equity fund had a good quarter (returning +7.1% vs. its benchmark, the FTSE All Share index, which returned -0.4%) and a good year (+24.5% vs. the index's +9.5%). Over one, three, five and 10 years the fund is either top or in the top four funds out of almost 200 funds. Safe to say we are happy with the way things have turned out. The average UK equity fund trailed the benchmark over this timescale. Clearly, we are doing something different
| Three months | Six months | One year | Three years | Five years | |
|---|---|---|---|---|---|
| Artemis SmartGARP UK Equity Fund | 7.1% | 12.7% | 24.5% | 37.1% | 66.5% |
| FTSE All-Share TR | -0.4% | 1.9% | 9.5% | 18.5% | 26.5% |
| IA UK All Companies Average | -1.3% | 1.0% | 7.9% | 5.0% | 15.2% |
Chart 1: SmartGARP UK - Outperformance
At the start of the year, fund managers tend to give year-ahead forecasts about some aspect of investing, whether it be the economy, the market, their fund or certain sectors or stocks. Since we run our money in a largely quantitative fashion, we tend not to express our personal views. This doesn’t always make for the most exciting commentaries, but I would like to think clients are more interested in the performance of the fund.
Nevertheless, the portfolio is in effect an expression of our views. So, looking at the top 10 stocks in our portfolio a year ago and comparing that to today can prove quite insightful:
| December 2023 | December 2024 | |||
|---|---|---|---|---|
| Stock | Sector | Country | % Fund | % Fund |
| HSBC | Banks | UK | 7.8% | 0.0% |
|
GSK |
Healthcare | UK | 6.3% | 3.8% |
| Imperial Brands | Food & beverages | UK | 5.3% | 5.1% |
| Bank of Georgia | Banks | UK |
4.5% | 4.1% |
| BP | Oil & gas | UK |
3.4% | 0.0% |
| Lancashire Holdings | Insurance | UK |
3.0% | 2.6% |
| Shell | Oil & gas | UK |
2.9% | 2.7% |
| Associated British Foods | Food & beverages | UK |
2.7% | 0.0% |
| TotalEnergies | Oil & gas | UK |
2.7% | 0.8% |
| Beazley | Insurance | UK |
2.7% | 2.5% |
The fund’s top 10 a year ago made up 41% of the fund. Those same stocks made up 21% of the portfolio by the end of the year. 2024 was a fairly normal year in turnover terms – we cut about half of our positions. So, our views are strong, but we are prepared to change them.
Switch HSBC into Barclays
A year ago, our biggest position was in HSBC. Today we hold no shares in the company. Since the stock rose sharply over the course of the year, it meant that this was our biggest detractor from performance of the fund (it cost us 1.4% points). Selling the stock might strike you as one of the stupidest mistakes of 2024.
In fact, it was one of our best decisions because we switched the proceeds into Barclays. Our holding in Barclays added 2.2% points to performance over the course of the year. The catalyst was the Dec ’23 results for the banks which were reported in February 2024. HSBC had in line numbers, some disappointing aspects and hence saw some minor downgrades to profit forecasts. In contrast Barclays' results were better and analysts raised their 2024 profit forecasts. Chart 2 illustrates the relative performance of Barclays against HSBC and the relative 12-month forward EPS forecasts.
Chart 2: Barclays vs. HSBC
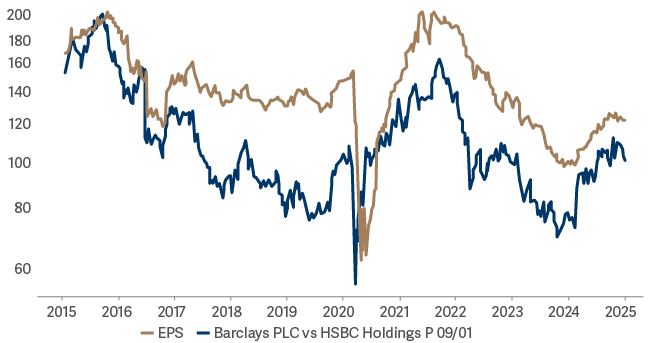
Barclays' share price had fallen over the previous two years because it was always 'jam tomorrow' story. The upgrades in February were the catalyst for us to change our view and Barclays is today’s biggest position in the fund. We were overweight in the bank sector and remain so. Why sell HSBC rather than just bulk up the sector position? Because we try to control risk and keep our sector over/under weights to +/-10% points.
Reduced exposure to oils
We sold the positions in BP and Total. A weak oil price last year caused estimates and share prices to fall. Some investors avoid commodity sectors altogether because they are so unpredictable. For us they are always fair game and over the years we have added good performance from taking significant over and under weights in this sector. We are currently slightly underweight this sector.
Sold AB Foods
The other top 10 position we cut was AB Foods. We owned it because it was reasonably priced and recovering. The results in September ’24 brought this thesis into question and so we sold the position. Ideally, we would have sold it earlier, but it could have been worse – the share has continued to underperform. Over the year it cost us 40bp.
Imperial Brands – sit tight and enjoy the ride
Demand for tobacco continues to decline and tobacco manufacturers remain (like oil) on the list of stocks people love to hate for what they do. They are less hated by investors than a year ago, and it was our fourth biggest contributor to performance. Again, a picture tells a thousand words:
Chart 3: Imperial Brands vs FTSE All Share
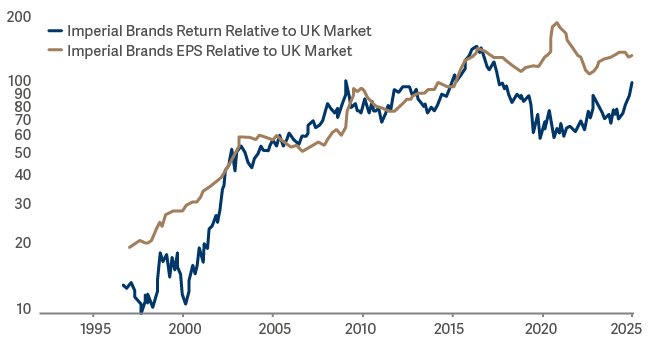
A well-run company with declining sales can be a great investment – especially when the valuation multiple is low. The stock is less cheap than before, but we are happy to sit tight. We chose to have Imperial Brands rather than its competitor BATS. This was a good idea. In reality we should probably have held both!
Current positioning
The fund sits on a prospective price/earnings (PE) multiple of 7.5x which is about 35% lower than the market's overall multiple. This is less of a value tilt than a year ago but is still significant. On my estimates the fund is on a lower PE multiple than the 104 largest active UK funds and the seventh lowest of the largest 2847 active equity funds globally. Nevertheless, the fund continues to focus on stocks with upgrades to profit forecasts. Upgrades imply that these lowly valued companies might actually be growing faster than investors had forecast. To stay with upgrades, the fund has shifted towards less risky stocks (Tesco, Coca-Cola HBC, Roche and Hikma were added last year). At a time when investors are getting more optimistic on cyclicals, our fund has less exposure to risk than pretty much any other time since 2003.