The ‘John Lennon stocks’ hurting European fund managers
The shift from value to growth has led many professional investors into the same type of company in the hope their shares will carry on rising. Product specialist, Harry Eastwood reveals how to avoid the sort of ‘instant karma’ they experience when valuations revert.
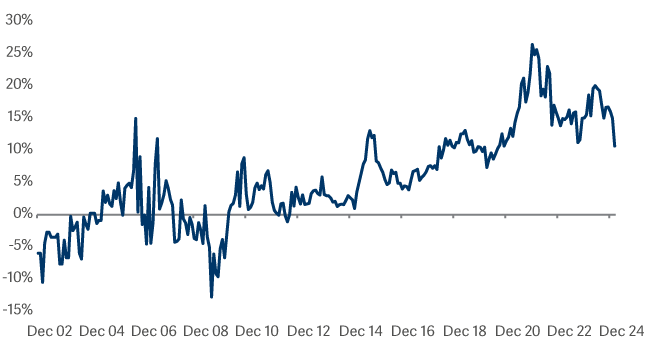
Check out the price/earnings chart below and see if you can work out which John Lennon song pops into my head every time I look at it. And before you ask – no, it’s not “Give P/Es a Chance” (sorry).
The chart shows the P/E ratios of actively managed European equity funds versus those of the index. It reveals how active managers in this arena have transitioned from being value investors in 2002 to being growth investors in 2025.
All told, the move represents a shift from a 10% discount to a 20% premium. This kind of makes sense, given the extended period during which growth has outperformed value in Europe1.
Crucially, though, the tables have turned more recently, with value outstripping growth over the past three years2. This is why a large proportion of managers have underperformed the benchmark during that period3.
So why have they refused to face up to reality and adjust their exposures? Look at the top-10 holdings of most funds and you’ll see enormous overlap. Too often managers have crowded into the same stock in the belief it will just carry on rising.
It’s in light of this shared delusion that Lennon enters the picture. As he famously sang in “Imagine”: “You may say I’m a dreamer, but I’m not the only one…”
Active Funds PE vs Index Funds (Europe ex UK Universe)
When growth investing goes wrong
Danish healthcare company Novo Nordisk offers a classic illustration. Many market participants became overly positive about its future prospects, only to see its attractions dwindle dramatically.
Novo was a darling of fund managers for many years. Not least amid mounting investor excitement about the company’s Wegovy weight-loss drug, its performance shot up by around 400% between 2018 and mid-20244.
The business’s P/E rocketed from 22x to 51x during the same period5. The latter figure represented both a significant premium and major optimism. But then things started to go wrong.
Developing new drugs is always a complex business. Fierce competition from Eli Lilly in the US heaped further pressure on Novo6, giving rise to the risk of ostensibly small setbacks being greatly magnified – and that’s exactly what happened.
Novo missed its consensus estimated earnings for Q2 20247. It then saw Wegovy sales fall, especially in the US8. Its investment appeal has since reduced faster than a devoted weight-watcher’s waistline.
With analysts revising down their projections for future growth9, the company’s share price has halved in a year10. All the dreamers who thought it might never stop going up have learnt a painful lesson.
The move from value to growth
Looking again at the above chart, we can see fund managers were predominantly value hunters in 2002. However, both from a fundamental and a share-price perspective, value began to underperform the market in 200611 – an experience that tempted many investors to ramp up their bets.
The relative P/E ratio for active funds was 29% higher than that for index funds by the end of 202112. The era of quantitative easing (QE) may have been a factor, with the low cost of debt encouraging investment in the expectation of never-ending growth. Unfortunately for the dreamers – and this is often the case with financial markets – peak optimism coincided with excessive valuations.
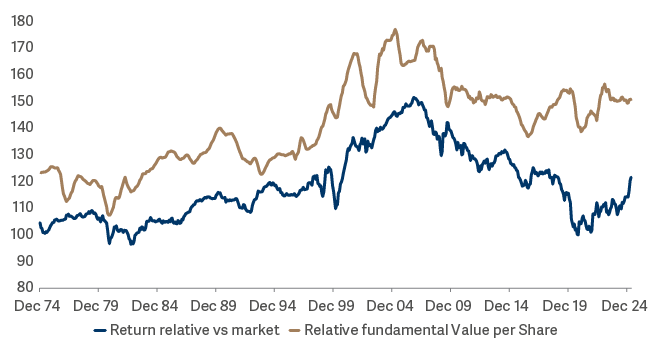
As the chart below shows, value stocks started to recover around 2022. Their valuations were extremely good at that point, as illustrated by the large gap between the gold and blue lines, and their fundamentals were improving, as illustrated by the gold line’s rising trajectory.
Fast-forward to the present day and the reality is that the era of QE is well and truly over. We’re looking at a return to value and most managers still have some way to go to rebalance their portfolios accordingly.
MSCI Value vs MSCI Europe
The long-term benefits of a value strategy
Having a value focus has been a drag for us on occasions, but over the long term it has served us well. The Artemis SmartGARP European Equity Fund is top of its peer group over one, three and five years13. Ultimately, experience tells us expensive stocks tend to fall sharply when their growth stories stumble and the optimism seeps away – as the Novo Nordisk saga has demonstrated.
Of course, quality matters. When value outperforms it’s not because all value stocks rise – it’s because a handful rise exceptionally. The secret is to pick the best ones and avoid the value traps.
So we salute our peers when they talk about selecting great companies – but just be careful what you pay for them! Like Lennon, you may well imagine there’s no hell below us and only sky above, but there are limits to how far a stock can rise in price.
And when it plunges – well, that’s not a dream. It’s a nightmare.
2 & 3Morningstar as at 28 February 2025.
4Bloomberg
5Factset
6 & 7https://www.theguardian.com/business/2025/may/07/wegovy-maker-novo-nordisk-cuts-profit-forecast
8https://www.reuters.com/business/healthcare-pharmaceuticals/obesity-drugmaker-novo-nordisk-cuts-2025-outlook-posts-q1-profit-above-forecast-2025-05-07/
9https://www.barrons.com/articles/wall-street-trims-ratings-for-novo-nordisk-stock-as-ozempics-competition-grows-10e4f87c
10Bloomberg as at 22/05/2025
11MSCI as at 30 April 2025.
12Morningstar as at 28 February 2025.
13Artemis as at 30 April 2025, Factset