Artemis SmartGARP European Equity Fund update
Philip Wolstencroft and Peter Saacke, managers of the Artemis SmartGARP European Equity Fund, report on the fund over the quarter to 31 March 2023 and the outlook.
- As last year’s winners became this year’s losers (and vice versa) the fund rose by 6.2%, versus a gain of 8.6% in the benchmark index*.
- Our value bias remains substantial: our holdings currently trade on a 33% discount to the European market in price-to-earnings terms.
- The fund’s historic price-to-earnings ratio is in the lowest 1% of all active equity mutual funds and unit trusts analysed by Morningstar.
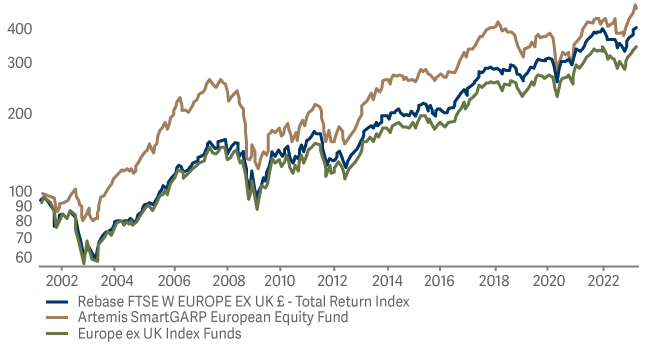
The fund returned 6.2% in the first quarter while the FTSE World Europe (ex-UK) index rose by 8.6%. Despite lagging its benchmark over the quarter, it remains in the top quartile of its sector over the past few years (admittedly, we still have some way to go before we catch up with our previous relative highs). The ‘problem’ in the first quarter was a sudden reversal in the stocks leading the market: last year’s biggest winners were the first quarter’s biggest losers. And, since the fund owned a lot of winners last year (it generated a return of 2.0% in 2022 while the index fell by 7.0%) it shouldn’t be a surprise that most of our stocks have been losers so far this year.
In many ways, this is simply normal market volatility. Markets are always looking for a new theme and investors are currently ignoring tried-and-tested concepts (such as value and growth) and focussing on the latest worry (two US banks going bust). The fund has high exposure to stocks with good value and upgrades to profit forecasts. And while this did not help us over the quarter, systematically focusing on these factors is, we believe, a winning strategy over time.
Chart 1: The Artemis SmartGARP European Equity Fund has been a long-term winner
Oil stocks underperformed
Our biggest losers over the past quarter included holdings in the oil sector. Markets worried about falling oil prices, ignoring the low valuations and capital discipline seen across the energy sector. We responded to this angst by reducing our overweight position in the sector somewhat. Our suspicion, however, is that when the bad news on the oil price ends, there should be a good deal of upside here.
Bad banks?
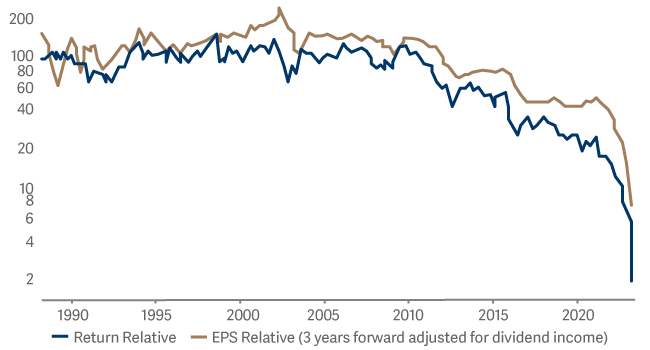
The bank sector is a big overweight for the fund but had practically no positive or negative impact on its relative returns over the course of the quarter. Nevertheless, the collapse of a few small US banks and the implosion of Credit Suisse captured the imagination of many investors and stockmarket commentators. Chart 2 illustrates our perspective on the slow demise of Credit Suisse over the previous decade (down about 90%) before its sudden implosion this year. Some will argue that this is the reason why you should never own any bank. Our perspective is slightly different: it is wise to avoid any stock whose earnings are collapsing.
Chart 2: Credit Suisse’s earnings per share – and share-price returns – relative to the wider European market
Contrast this with Chart 3, which shows the wider European banking sector.
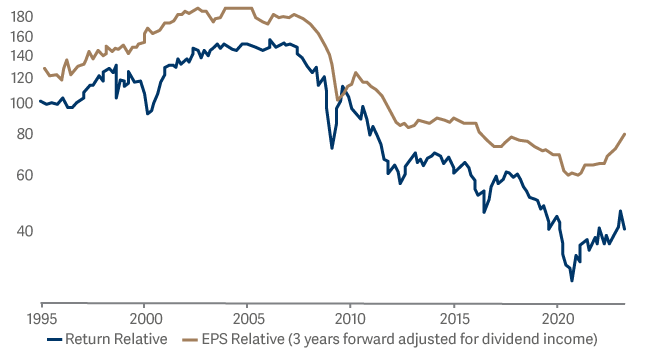
Over the past 28 years (which includes the global financial crisis), the earnings per share of European banks have fallen by about 2% per annum. This is a poor record. Note, however, that through to 2021 their share prices had been falling more by about 4% per annum as more and more bad news was discounted.
Moreover, despite all the bad news about failing banks and bad debts, the sector has actually been delivering superior growth over the past couple of years (the red line in Chart 3 has been trending higher). The market had been losing some of its scepticism towards the sector. We exploited this change by owning banks with good growth and upgrades to profit forecasts. We see no signs that the uptrend is over; a good deal of upside remains. After all, bull markets are all about climbing a ‘wall of worry’.
Outlook
Today, the European equity market is slightly cheaper than the wider global equity market. Its prospective price-to-earnings ratio is about 85% that of the global index. Our fund’s holdings, in turn, trade on about half of the valuation multiple of the Europe ex-UK market – so about 40% of the prospective price-to-earnings ratio of the global market.
Of the c.4000 largest active equity unit trusts and mutual funds in the world, our fund has the 19th-lowest historic price-to-earnings multiple. And of the 440 Europe ex-UK, Eurozone and pan-European funds, ours has the third-lowest price-to-earnings multiple. So, we undoubtedly have a value bias in this fund and, indeed, across Artemis’ range of SmartGARP funds.
We do not have a high exposure to stocks which most investors regard as ‘growth’ companies. There are several reasons for this but chief among them is that we believe they are overpriced for the limited excess growth they promise. When investors overpay for growth, they tend to suffer inordinately when that growth slows – or disappears. Our preference is to focus on companies whose profit forecasts are rising by more than the market. This is a more sustainable predictor of future returns. This is evidenced by Chart 4.
Chart 4: The share prices of our holdings have yet to catch up with their improving fundamentals (FVPS)
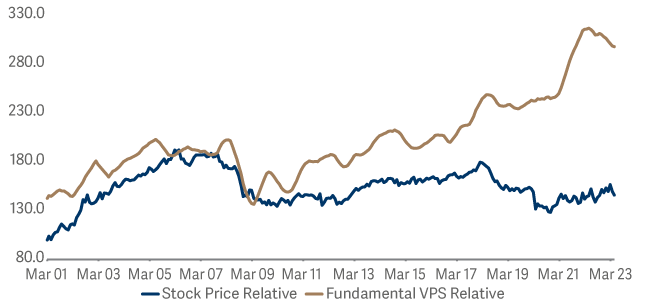
Over the past 22 years, the fundamental value per share (‘FVPS’ which combines various measures of corporate success such as profits, cashflows and dividends) of our fund has been compounding at about 3% per annum faster than the European market. In constantly focussing the portfolio on factors that lead to subsequent growth (such as upgrades to earnings forecasts), the FVPS has been steadily driven up over time. The relative unit price of our fund (blue line) has broadly tracked the rise in FVPS relative (bronze line) but it has lagged by about 1.5% per annum. In effect, our stocks have, in share-price terms, become cheaper by about 1.5% per annum relative to their fundamentals.
This reflects the falling out of fashion of ‘value’ stocks over the past decade. My suspicion is that fashion will shift in our favour over the next few years. Until it does, we can rely on our edge (delivering faster growth in fundamental value per share) to reward our unitholders.
Keeping it simple: why we are so positive on the outlook for our fund
We remind ourselves that the return from any asset is roughly its yield plus the subsequent growth in dividends. The European market has a prospective dividend yield of 3.4% and a record of dividends growing about 1-2% per annum faster than consumer prices. As such, a 5% real return seems like a good guesstimate of the future returns the European market will produce from this point.
And as for our portfolio? We own stocks with a 1.7% higher yield and a track record of delivering 3% extra growth in fundamental value per share. That is why we are so positive on the outlook for our fund.
* Source: Lipper Limited/Artemis from 31 December to 31 March 2023 for class I accumulation GBP.
All figures show total returns with dividends and/or income reinvested, net of all charges.
Performance does not take account of any costs incurred when investors buy or sell the fund.
Returns may vary as a result of currency fluctuations if the investor's currency is different to that of the class.
Classes may have charges or a hedging approach different from those in the IA sector benchmark.
Benchmarks: FTSE World Europe ex UK TR; A widely-used indicator of the performance of European stockmarkets, in which the fund invests. IA Europe Excluding UK NR; A group of other asset managers’ funds that invest in similar asset types as this fund, collated by the Investment Association. These act as ‘comparator benchmarks’ against which the fund’s performance can be compared. Management of the fund is not restricted by these benchmarks.