Artemis SmartGARP European Equity Fund update
Philip Wolstencroft and Peter Saacke, managers of the Artemis SmartGARP European Equity Fund, report on the fund over the quarter to 30 September 2023 and the outlook.
Review of the quarter to 30 September: Lower valuations + higher growth = outperformance
The fund is performing well. Over the third quarter, it returned 4.1%, outperforming the benchmark FTSE World Europe ex-UK index, which fell by 1.6%. Over the past three years, the fund has returned 56.1% versus a return of 28.3% from the index, aided by its relatively high exposure to stocks trading on below-average valuations.
The list of third quarter’s winners was long and broad
This quarter’s biggest contributors were typically diverse. They included our holdings in:
- Birlesik Magazalar (a Turkish food retailer);
- Talanx (a German insurer);
- Stellantis (the parent company of Fiat and Peugeot);
- Repsol (an oil company);
- UniCredit (an Italian bank);
- Mytilineos (a Greek industrial);
- Commerzbank (a German bank);
- Turkiye Is Bankasi (a Turkish bank);
- Scor (a French re-insurer); and
- Telekom Austria.
The only common theme here is that we own stocks that are trading on below-average valuations whose earnings are growing. While the market still dislikes these types of stocks, it dislikes them slightly less than it did a few months ago. Despite this, the valuations of unfashionable stocks remain unusually low.
The quarter’s list of negatives, meanwhile, was comparatively short:
- Not owning Novo Nordisk, which makes weight-loss drug Wegovy, wasn’t helpful.
- Our relatively high exposure to airlines (such as Lufthansa and Air France-KLM) was a drag.
The table illustrates some of the portfolio’s financial characteristics relative to the market in general:
| 12-month forward p/e | 12-month forward dividend yield | 12-month forward return on equity | Pay-out ratio | |
|---|---|---|---|---|
| Fund | 6.0x | 5.8% | 13.8% | 35% |
| Benchmark | 12.4x | 3.7% | 13.9% | 45% |
| Relative | -52% |
+56% |
-0.1% | -22% |
That the dividend yield on our portfolio is 2 percentage points higher than on the index would seem to imply that investors expect our companies to grow by 2% per annum less than the market for the rest of our lives. However, the profitability of our companies (their return on equity) is on a par with the market and the dividends they are paying out represent a smaller percentage of their earnings.
What makes our companies really exciting to us, however, is the newsflow: our companies have been seeing their profit forecasts increasing. Earnings revisions are typically a good predictor of future growth – which is why SmartGARP looks for them. Over the last six months, earnings per share forecasts for the European market in 2024 have fallen by about 3%. Forecasts for our companies earnings per share, however, have risen by around 5%. This gives us confidence that our companies will, in fact, outgrow the market.
Moreover, we have two decades of evidence that our system correctly identifies companies that subsequently outgrow the market. The combination of dividend yield plus actual growth in ‘fundamental value per share’ (a mix of various measures of corporate success such as profits, cashflows and dividends per share) for our fund and the market is illustrated below:
Annualised growth in fundamental value per share
| One year | Three years | Five years | 10 years | Since inception | |
|---|---|---|---|---|---|
| Fund | 10% | 27% | 14% | 13% | 12% |
| Benchmark | 7% | 17% | 8% | 8% | 8% |
| Difference | 2% | 9% | 5% | 5% | 3% |
Since the fund’s launch in 2001, the market has seen its fundamental value per share growing by about 8%. Our fund, meanwhile, has seen fundamental value per share compounding at nearer to 12%. The reason that the fund’s return has lagged the growth in its FVPS is because we have been in an environment in which investors rewarded ‘perceived growth’ (stocks with compelling stories about their future potential) rather than ‘actual growth’. In my view, that simply means that returns from actual growth stocks (many of which now trade on below-average valuations) have been depressed and that future returns have therefore increased.
The fund's recent relative returns ('stock price relative') have lagged the growth in its fundamental value per share
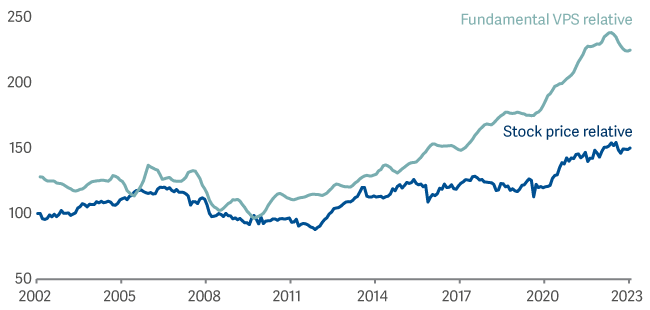
Note: fundamental value-per-share (VPS) is a combined measure of earnings, cash flow, operating profits, dividends and asset value per share
Looking ahead with confidence
None of us know what the future holds. We will only outperform if we can continue to find companies that outgrow the market. But what we can say with confidence is that we have a process that has worked for more than two decades. We think that process gives us an edge because it is objective – it rewards actual growth, rather than the promise of growth. Investors are not automatons, but emotional human beings. That means they have a habit of chasing dreams rather than doing simple things well, year in, year out. I believe that if we stick to our process – and stick to doing simple things well – then our fund has a good future ahead of it.
All figures show total returns with dividends and/or income reinvested, net of all charges.
Performance does not take account of any costs incurred when investors buy or sell the fund.
Returns may vary as a result of currency fluctuations if the investor's currency is different to that of the class.
Classes may have charges or a hedging approach different from those in the IA sector benchmark.
Benchmarks: FTSE World Europe ex UK TR; A widely-used indicator of the performance of European stockmarkets, in which the fund invests. IA Europe Excluding UK NR; A group of other asset managers’ funds that invest in similar asset types as this fund, collated by the Investment Association. These act as ‘comparator benchmarks’ against which the fund’s performance can be compared. Management of the fund is not restricted by these benchmarks.