Artemis SmartGARP Global Equity Fund update
Peter Saacke, manager of the Artemis SmartGARP Global Equity Fund, reports on the fund over the quarter to 30 September 2023 and his views on the outlook.
Holding up well in challenging market
- Fund up 3.0% versus 0.6% rise of benchmark during the quarter, both boosted by 4% decline in sterling versus the US dollar.
- Rising oil prices and higher bond yields weigh on investor sentiment.
- Eclectic mix of winners hailing from all corners of the world.
- Still most overweight Banks, Insurance and Staples, underweight Tech, Financials and now also Industrial.
- Prefer Europe (not least UK), Emerging Markets and Japan to US equities.
- Fund sticking to its tilt towards value and low risk
- Pockets of opportunity remain
Performance – Diverse mix of winners drive outperformance in challenging market
Rising oil prices coupled with concerns over the US fiscal outlook helped drive long term bond yields to their highest levels in years. In turn, this weighed on markets in general and richly valued sectors and stocks in particular.
The MSCI All Country World index was up marginally in sterling terms (+0.6%), though this is flattered by the 4% decline in the pound versus the US dollar. UK and Japanese equities outperformed, while continental European equities were weakest. Energy stocks performed best by far, with communication services stocks, banks and insurance also holding up well. Utilities, industrials and technology stocks struggled, by contrast.
These trends were broadly supportive of the performance of our fund. Our overweights in the UK and Japan helped, as did our large underweight in tech. For the quarter as a whole, the fund’s net asset value rose by 3.0% versus a benchmark return of +0.6% in sterling terms.
The fund’s best performers in Q3 were an eclectic bunch of stocks, including Japanese industrial Toyota Tsusho, Chinese insurer Picc Property & Casualty, Chinese oil producer CNOOC, US retailer Sprouts Farmers Market, UBS, Mitsubishi UFJ Financial Group, Emirates bank and US insurer Metlife. Not owning any shares in index heavyweight Apple also contributed meaningfully to relative performance.
On the negative side, only our holdings in Chinese social media company Hello Group, in China Railway Group as well as our lack of exposure to strongly performing Nvidia and Eli Lilly stood out.
Activity – Extending overweight Energy and adding to Healthcare
The most significant change in the positioning of the fund during the quarter was to add meaningfully to our exposure to the energy sector with purchases of US oil stocks such as Exxon Mobile, Chevron and Valero Energy in particular. We also increased our weighting in the healthcare sector, buying back into the likes of Merck, Amgen, Sanofi and UnitedHealth. Last but not least, we added to our exposure to Chinese online retailers Alibaba and Vipshop, both of which offer a reacceleration of earnings growth, but trade at depressed valuations.
These purchases were funded from sales in the industrial sector (3M, Qinetiq, Agco and Terex), technology (Oracle, Cisco and Hello Group) and Insurance (ASRNL).
Still, in spite of these changes, the fund’s principal exposures have not changed dramatically: Regionally we continue to be overweight in European equities (28% versus 16% benchmark weight), emerging markets (18% of fund versus 11% benchmark weight) and Japan (9% versus 6%) and underweight especially in the US (42% versus 62%). At the sector level, we still prefer banks, insurance and consumer staples and remain very underweight technology and, to a lesser extent, financial services and industrials.
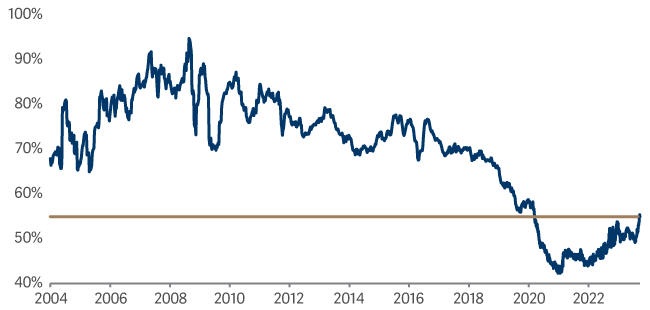
Last, but not least, the fund’s tilt towards value stocks, that is stocks trading on below market valuations, remains very pronounced. At the end of September, the fund was trading on an average price-earnings ratio of 8.4 versus the benchmark at 15.5. This 45% discount to the market remains very low in the context of the almost 20 years the present manager has managed the fund.
Relative price-earnings ratio of SmartGARP Global Equity Fund vs. market
Outlook – Cloudy market outlook with pockets of opportunity
It seems likely that the delayed impact of the significant monetary tightening of the last 18 months coupled with higher oil prices and bond yields will make for challenging market conditions going forward. At the same time, however, it strikes us that the narrow list of stocks that have led global equity markets higher in recent years has left a number of pockets of attractive investment opportunities. As mentioned above, these include the UK, Japan and parts of continental Europe and emerging markets.
Therefore, while we are not particularly optimistic about the outlook for markets in general, we are rather more sanguine about the outlook of our fund. Our approach remains to be squarely focused on what companies are telling us regarding their individual business prospects to ensure that the fund’s positioning reflects this in a timely manner. Against this backdrop, our fund’s bias towards companies with resilient earnings and healthy balance sheets, which, as an additional layer of protection, trade on well below market valuations, continues to be warranted, in our view.
Source: Lipper Limited/Artemis from 30 June 2023 to 30 September 2023 for class I accumulation GBP.
All figures show total returns with dividends and/or income reinvested, net of all charges.
Performance does not take account of any costs incurred when investors buy or sell the fund.
Returns may vary as a result of currency fluctuations if the investor's currency is different to that of the class.
Classes may have charges or a hedging approach different from those in the IA sector benchmark.
Benchmarks: MSCI AC World NR; A widely-used indicator of the performance of global stockmarkets, in which the fund invests. IA Global NR; A group of other asset managers’ funds that invest in similar asset types as this fund, collated by the Investment Association. These benchmarks act as ‘comparator benchmarks’ against which the fund’s performance can be compared. Management of the fund is not restricted by these benchmarks.