Artemis SmartGARP European Equity Fund update
Philip Wolstencroft, manager of the Artemis SmartGARP European Equity Fund, reports on the fund over the quarter to 30 September 2024 and the outlook.
Source for all information: Artemis as at 30 June 2024, unless otherwise stated.
- Ahead of the index on the quarter and year to date
- Reduced the autos exposure
- 'Value' stocks seeing upgrades to earnings equates to strong growth
The fund's return was 2.1% in the second quarter and is 15.6% year to date. The respective numbers for the benchmark are +0.3% and +7.1%. So, the stocks we own are delivering good returns and are outperforming the market. We think this is business as usual.
| Three months | Six months | One year | Three years | Five years | |
|---|---|---|---|---|---|
| Artemis SmartGARP European Equity Fund | 2.1% | 15.6% | 23.3% | 41.1% | 57.1% |
| FTSE World Europe ex UK | 0.3% | 7.1% | 13.4% | 22.0% | 50.7% |
| IA Europe excluding UK Average | -0.4% | 5.6% | 11.8% | 14.9% | 43.5% |
Since launching this fund in 2001, our investment process has evolved (albeit glacially) and it would appear to be effective. Essentially, we try to buy stocks that are lowly priced, growing and delivering pleasant surprises. The result is that we own stocks whose fundamentals end up having a better combination of growth and income than the market and our competitors. While it can sometimes feel uncomfortable to 'be different', we end up with a bunch of stocks that bear little resemblance to either the market or our competitors. Looking at the performance statistics above – this is probably a good thing.
Three months ago, our top five holdings included the likes of Unicredit (Italian bank), Stellantis (Fiat-Chrysler-Peugeot), Heidelberg Materials (German cement), Talanx (German insurance) and Renault. Unicredit, Heidelberg Materials and Talanx are still in our top five, but we have substantially trimmed our car exposure because our process has nudged us in this direction. In both cases they have delivered good profit results but there are signs of difficulties appearing and analysts have started to trim their profit forecasts. When this happens, we tend to cut our exposure in case this is the start of a (painful) trend.
Repsol (Spanish oil company) and Novartis (Swiss pharmaceuticals) entered the top five as we topped up positions on the back of low valuations and good newsflow. Repsol is seen by many as a low-quality business with a big chunk of its assets in South America. We look upon it as a well-run company whose management are fed up with being treated by investors with such disdain and so are paying out dividends and buying back shares that amount to over 10% of the market capitalisation of the company. Sooner or later investors tend to wake up and realise that the shareholders are being looked after and we then see the shares re-rated. This happened to a previous big position Unipol (Italian Insurer). They have been lowly rated for somewhile but the persistent high dividends and more recently buying in the minority holdings of a subsidiary have transformed sentiment whereby the share price has gone up over 80% this year and the PE multiple has gone from a ridiculously low 4.6x prospective earnings at the start of the year to 7x more recently. This is not rocket science – just doing simple things well.
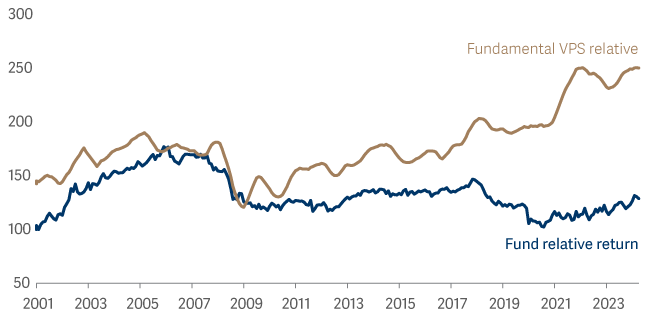
For the fund in total the prospective price/earnings ratio is 7.3x whereas the market is on 13.9x earnings. This ought to mean that we have poor quality companies. In reality, our companies are growing in line with their competitors, buying in shares (-2% over the past year) and seeing upgrades to profit forecasts (+3% in the past quarter). Over the past two decades the fundamental value per share of our fund has outgrown the market by over 2% per annum. There is no reason to suppose that this trend is over, and I suspect that our fund will continue to stumble across companies with winning fundamentals. Ultimately share prices track these fundamentals:
SmartGARP Europe
My view is that if we keep nudging our portfolio towards companies with good financial characteristics the probability increases that the result will be good financial returns over the long term.