Artemis SmartGARP European Equity Fund update
Philip Wolstencroft, manager of the Artemis SmartGARP European Equity Fund, reports on the fund over the quarter to 31 March 2025.
Source for all information: Artemis as at 31 March 2025, unless otherwise stated.
Summary
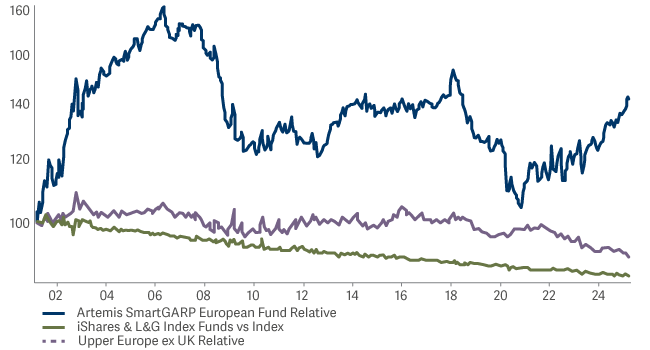
The fund had a great first quarter, rising by 16.1% compared with 7.6% from its benchmark and 5.5% from its IA peer group. All relative performance statistics over one, three and five years (as well as since inception) look strong. We have been saying for some time that Europe is undervalued compared with the US and that within Europe ‘value’ stocks are underpriced, so it is good to see these mispricings start to narrow.
| Three months | Six months | One year | Three years | Five years | |
|---|---|---|---|---|---|
| Artemis SmartGARP European Equity Fund | 16.1% | 16.8% | 19.4% | 64.0% | 154.1% |
| FTSE World Europe ex UK | 7.6% | 3.5% | 3.8% | 28.4% | 84.4% |
| IA Europe excluding UK Average | 5.5% | 1.2% | 0.9% | 19.3% | 73.9% |
Performance vs Benchmark
Value dominates
Over the past 120 years, value stocks have outperformed the market by almost 1.5% per annum, as although growth has behaved similarly in share price terms, the dividend yield on value has been about 1.5% higher.
For about 10 years up to 2016, value stocks experienced poor growth and underperformed, while growth investing became the dominant theme. Since then, unloved value companies have delivered similar or better EPS (earnings per share) and DPS (dividends per share) to those experienced by growth stocks, but that did not stop them from becoming cheaper. While most active funds chose to go further underweight in value, we chose to go in the opposite direction, which has paid off handsomely.
According to our estimate, since reaching their nadir in 2021, value stocks are now about halfway through the recovery phase (being up 20% versus the market with another 20% to go, while taking into consideration the normal small annual alpha from the ‘value’ factor). As such, there is still a decent tailwind behind us.
At the start of the year, we estimated that about 85% of AUM (assets under management) in the IA Europe ex UK sector had a negative value tilt compared with index funds. Yet a value tracker fund would have beaten the market by almost 7%, so this has been a painful period for most active funds. The growthier-type funds tend to have low turnover of positions and so 83% of AUM is nonetheless still anti-value. Again, this suggests we still have a tailwind behind us. It probably won’t be the fund managers that change their behaviour: it will be their clients.
Not a one-trick pony
As we have observed in the past, the fund has several factors that feed into it, the most important being estimate revisions as we tend to buy stocks that are both cheap and seeing upgrades. The chart below illustrates our best guess of how the largest IA Europe ex UK funds are positioned on both value and estimate revisions (versus index funds).
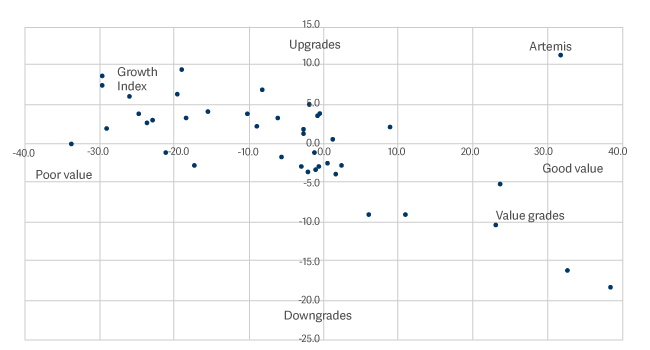
Value funds seem to own stocks that are being downgraded, while growth funds tend to own stocks that are being upgraded. We stick out like a sore thumb – and we suspect that is why the fund is somewhat ahead of the competition.
It may be tempting for some investors to think that if growth funds own upgraded stocks they will be safe, but we suspect not. The reason is that subsequent downgrades for highly rated stocks can be very painful.
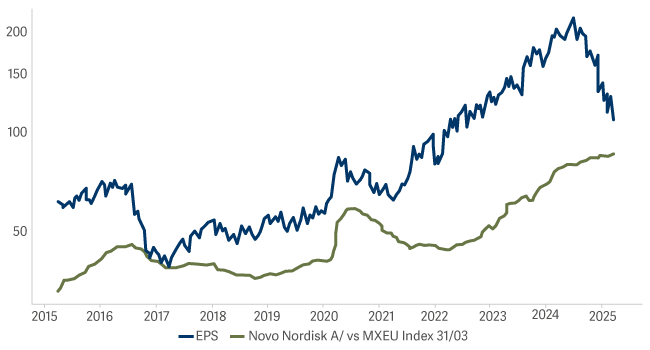
Investors in LVMH found this out in 23/24, while those invested in Novo Nordisk found it out more recently. Since forecasts peaked in August 2024, EPS estimates for Novo Nordisk have been cut by 7% and the share price has halved as investors were expecting good news, not bad news (in the chart below, the blue line is return-relative and the green line is rolling 12-month-EPS forecast relative). It may be that our fund moves back into this stock at some point, but we are generally cowards and will wait for extremely low valuations or good news – and we have seen neither so far.
Novo Nordisk versus the European market
Contributors
During the quarter, avoiding Novo Nordisk was our most successful decision. Our lack of exposure to ASML also contributed from a relative perspective.
However, of our 20 largest contributors, 17 were stocks that we owned rather than avoided. Key examples were UniCredit, Lottomatica, Indra and Bilfinger, an eclectic bunch comprising a bank, a lottery company, a defence software business and a construction/engineering business respectively. Arguably we got lucky with the last two mentioned, which benefited from the new fiscal/defence expansion plans of western European governments. However, the common theme was that valuations were low and upgrades had been coming through for a while, so investors lost some of their concerns about the profit outlook for these companies.
Detractors
Stock selection within healthcare harmed performance, largely driven by our holding in Teva Pharmaceuticals (our largest detractor of the quarter), which suffered after a mixed Q4 earnings report. Our position in H. Lundbeck, another pharmaceutical company, also detracted.
From a relative point of view, not owning Nestlé hurt the fund after a recent set of earnings lifted the stock, although we think challenges persist as the company has been trading at a premium to the market without the fundamental support.
Activity
We made a major rotation by switching almost half of our UniCredit holding into a new position in Societe Generale, representing both our biggest sale and purchase of the quarter. Banks remain attractive to us as they trade at discounted valuations while experiencing superior fundamental growth. We noticed that, after three years of outperforming a sector that itself had been outperforming the broader market, UniCredit has recently started to perform in line with the sector.
Conversely, the fundamentals have turned in favour of Societe Generale after a fairly sustained period of underperformance, with its share price now trading at a discount to the sector. It therefore seemed to be a more attractive opportunity relative to UniCredit, which informed our capital-allocation decision.
Besides UniCredit, on the sales side we exited CaixaBank and reduced our holding in another bank (Banco Comercial Portugues), while we also said goodbye to Teva Pharmaceuticals on poor earnings. We also sold out of Essity (consumer goods), Traton (industrial goods) and Ericsson (technology), recycling the capital into the likes of Koninklijke Ahold Delhaize (retail) and Roche (healthcare).
We also added Equinor (oil & gas) and Loomis (industrial support services) and topped up our position in Vicat (construction & materials).
Outlook
The outlook for equities is highly uncertain because valuations in the US are expensive while its government appears to want to pick a fight with anyone outside its own borders, creating an unhelpful backdrop. However, it seems that investors in US equities have the most to lose, whereas in contrast valuations outside of the world's biggest economy are generally pretty attractive.
Although the threat of inflation is affecting the US, it is not a major problem globally and so we think interest rates and bond yields are probably heading sideways or downwards. Instead, the main risk is that earnings per share start to falter. This is where the fund can help out, as over the past year it has moved into less cyclical, more domestic European stocks, which is already proving to be beneficial.
Therefore, if we stick to our process of finding companies on low valuations that subsequently deliver good growth, then we believe the fund should do well. For 24 years now the fund has delivered good returns throughout all sorts of economic, political and financial backdrops. We see no reason for this to change.