Artemis SmartGARP European Equity Fund update
Philip Wolstencroft, manager of the Artemis SmartGARP European Equity Fund, reports on the fund over the quarter to 31 December 2024 and the outlook.
Source for all information: Artemis as at 31 December 2024, unless otherwise stated.
Summary
The Artemis SmartGARP European Equity Fund had a good quarter (returning +0.7% compared to the FTSE World Europe ex-UK benchmark which was down 3.9%) and a good year (+16.4% vs +3% for the benchmark). The fund was the best performing fund in its universe over one, two, three and four years and ranked 7th over five years. It appears that things are going in the right direction! Moreover, the evidence would suggest that there is still plenty of upside for our fund going forward.
To highlight a few tailwinds:
- Value stocks in general have faster growth (plus dividends) than the market.
- They are still abnormally cheap.
- European Investors are still skewed towards growth and away from value.
- Our tilt towards other factors (upgrades/momentum/accruals) gives us another edge.
| Three months | Six months | One year | Three years | Five years | |
|---|---|---|---|---|---|
| Artemis SmartGARP European Equity Fund | 0.7% | 0.7% | 16.4% | 36.6% | 54.1% |
| FTSE World Europe ex UK | -3.9% | -3.8% | 3.0% | 10.9% | 41.4% |
| IA Europe excluding UK Average | -4.1% | -3.9% | 1.5% | 4.6% | 33.9% |
Value is cheap and growing:
Chart 1 illustrates the relative performance of MSCI value stocks (as exemplified by the MSCI Value Index) in Europe against the broad MSCI Europe index. Returns broadly track the profile of relative value creation (income and growth – the gold line). Value did well from 1982 to 2007 and poorly in the subsequent 14 years. Markets are supposed to be anticipating the future but tend to extrapolate the past (which is why we think our process gives us an edge). This is seen clearly in Chart 1.
CHART 1: MSCI Value vs MSCI Europe
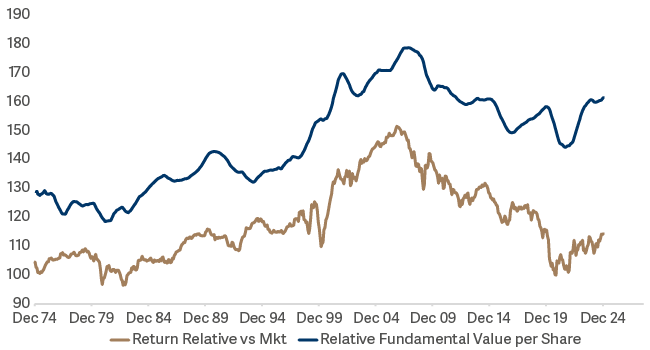
Historically, the relative fundamentals of value stocks have been good (going up), but they had a bad period from 2008-2022. For most people in financial markets this 14-year period since 2007 seems like a lifetime and so as the gold line heads south markets get smart and start to anticipate further bad news – thus the gap between the two lines widens. For the sharp-eyed amongst you, it might seem that if the gap is wide and the gold line is going up then value stocks are destined for a great decade. This is my view – but it is not the view of the fund management industry in general. Of the 293 largest active equity unit trusts, mutual funds etc with a Europe, Europe ex-UK or Eurozone benchmark, 69% have a negative tilt towards value (higher PE, lower yield etc) – incidentally this is largely a Europe-specific bias.
Our fund is not just a value fund
In 2024 value stocks in the Europe ex-UK space outperformed the market by about 2%. Our fund outperformed by nearer 13% – so it would appear that clients are getting a bit more than a value ETF.
The reality is that we buy stocks where the newsflow and other fundamentals are good/improving. So, for example we managed to avoid many of the cheap stocks which suffered death by a thousand cuts (to earnings forecasts) such as oil stocks.
Our biggest winners in Q4 were two banks (Banca BPER and Banco Commercial Portugues), two insurers (Talanx and Unipol) and then a diverse bunch including Teva (pharmaceuticals), Anima (fund management), Aker Solutions (oil), Betsson (online betting) and Lottomatica (lottery). Broadly speaking they were cheap with upgrades to forecasts, and we had decent-sized positions (>2% each).
Outlook
My belief is that SmartGARP has a repeatable and scalable edge. As a best guess I would say 2% p.a. of outperformance is not a bad target (based upon the average yield pickup and excess growth we end up with – trend in gold line in Chart 2). The fund has actually lagged this for 2010-2020 and so what we are witnessing is something of a catchup with reality. Chart 2 is similar to the first one, but rather than value stocks in general, it is our fund (after fees) vs. the benchmark:
CHART 2: SmartGARP Europe vs Europe ex UK Index
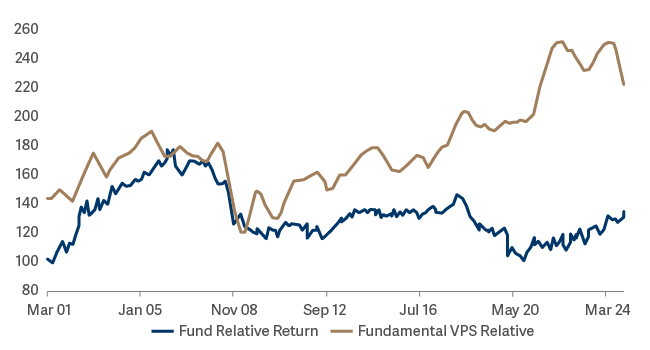
The gold line has been trending up at about 2% p.a. and I think that this is our 'alpha'. It looks like the fundamentals of our stocks were deteriorating sharply in the past year. In reality, it is because we have rotated from 'deep value' stocks into 'good value' stocks (on a technical note the first chart is a good approximation of the fundamentals because the turnover of the portfolio is glacial – hence changes in the gold line in Chart 1 are largely due to changes in the fundamentals rather than the constituents. For our fund it is a mixture of the two. In the long run though it reflects the fundamentals.
In the past year we have tended to sell out of some of our more cyclical names. Stellantis and Renault are obvious examples from earlier in the year and Volvo (trucks) is a more recent one. The buys have tended to be in less cyclical stocks on low – but not ridiculously low – multiples (Novartis and Teva earlier in the year, Roche and Engie more recently).
As an aside we track several factors for stocks (and hence our funds). One of these is 'risk'. We rank stocks according to things like debt/ebitda, interest cover, dispersion of EPS estimates, share price volatility etc. Chart 3 illustrates the weighted average 'risk rank' of our portfolio. It is interesting to note that our portfolio is less 'risky' than it has been in the past. It is not that we have taken an active decision to reduce the risk exposure, but in the context of a weak economy, rising economic optimism of investors and good value/fundamentals, we have increased our exposure in this area.
CHART 3: SmartGARP Europe - Risk Rank
![]()
Returns from any financial asset are a function of its yield, its future growth rate and the subsequent change in valuations. For much of the past decade or two it has been a trend change in valuations that has dominated performance. In 2024, fundamentals took on more importance. Long may this continue.