Artemis Monthly Distribution Fund update
The managers of the Artemis Monthly Distribution Fund, report on the fund over the quarter to 30 June 2025.
Source for all information: Artemis as at 30 June 2025, unless otherwise stated.
Overview
The second quarter was one of the most action-packed in recent memory. Global equities sold off sharply and volatility spiked to levels not seen since the pandemic in the wake of ‘Liberation Day’ and the apparent beginning of a new era of US protectionism.
However, thanks to several last-minute tariff suspensions and robust hard macroeconomic data, US equities posted a jet-propelled recovery, with the S&P 500 notching its fastest ever recouping of a 15% drawdown.
Outside equities, there were significant moves in both fixed income and currency markets. Clear worries about fiscal sustainability – principally in the US, but also in much of the Western world – have manifested in steepening yield curves and sharp rises in long-dated government bond yields.
The dollar had its worst first half-year in more than five decades and weakened against every other G10 currency, boosting returns for US investors in international assets. For example, the Stoxx 600 Banks sector has outperformed the NASDAQ by 47% year to date in dollar terms, versus 29% in local currency terms.
Against this backdrop, the fund made 6.3%, compared with gains of 3.2% from its IA Mixed Investment 20-60% Shares sector peer group.
| Three months | One year | Three years | Five years | |
|---|---|---|---|---|
| Artemis Monthly Distribution | 6.3% | 15.3% | 38.7% | 59.8% |
| IA Mixed Investment 20-60% Shares | 3.2% | 5.8% | 17.2% | 23.2% |
Contributors
Contributors to the fund’s strong performance were diverse in nature.
Our aerospace and defence companies continued to outperform, amid a step-change in attitudes towards the sector and talk of the NATO defence spending target rising to as much as 5% of GDP.
The gold price rose 25% versus the dollar in the first half, hitting several record highs. Shares of gold producer Kinross benefited from this.
Siemens Energy rose with a resurgent AI trade and reported strong quarterly earnings. It is also a beneficiary of a renaissance in nuclear power (manufactures turbines for nuclear power stations).
Our allocation to shorter-dated, higher-quality high-yield bonds (which account for the majority of the portfolio’s fixed income holdings) continued to generate a strong drumbeat of income for the portfolio. One bond of note was Foot Locker, which received an approach from Dick’s Sporting Goods in May.
Detractors
The most significant detractor over the quarter was our underweight to technology, with Nvidia, Microsoft and Broadcom (none of which we hold) the costliest individual names. Generally speaking, yields are low and valuations are high in the technology sector, so it is a challenging place to find appropriate investments for our fund.
Government bonds detracted, as yields climbed around the world. However, these were already a small allocation at the beginning of the quarter and we continued to trim the position.
Activity and positioning
Our exposure to government bonds has been falling for some time and is now less than 5% of portfolio capital. We do not see any credible plan to reduce fiscal deficits (with the One Big Beautiful Bill Act in the US set to fan the flames further), which alongside stubborn inflationary pressures constrains central banks’ ability to cut rates.
Another important change in recent years is the correlation between government bonds and equities. In the quantitative easing era of low rates, the two had a negative correlation and were therefore an effective combination in a multi-asset portfolio. However, this period was an exception to the rule.
'Tech and treasuries' no longer provides diversification
S&P 500 and long-term treasuries: rolling two-year correlation1
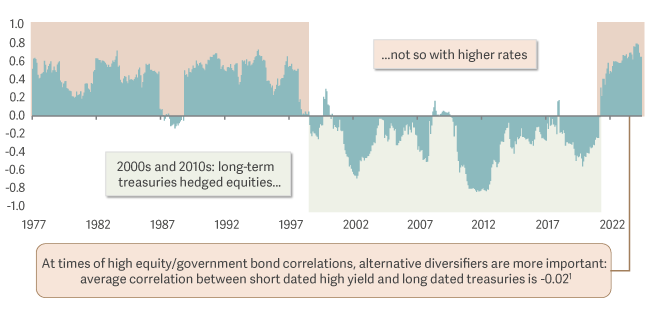
Our significant fixed income allocation is to higher-quality shorter-dated high yield, where we can clip high single-digit yields that can compound over time while taking minimal duration/interest rate risk. When the correlation between government bonds and equities rises, it is important to have differentiated sources of diversification and returns, such as short-dated high yield.
In equities, much of the portfolio remains allocated to underheld areas that initially may not look like income stocks (such as financials and defence). However, many of these companies have de-levered and de-risked in recent years, while profitability and dividends have grown substantially (as have share buybacks in the case of banks). Those are the credentials that we seek as income investors so we are happy to hold these areas. Fund performance has benefited significantly as a result.
Conversely, the ‘traditional income’ areas have a) taken on debt and b) struggled to grow dividends. Nestlé – once a darling of income portfolios that at one point traded on almost 30 times earnings – posted its worst monthly share price return for 10 years in June.
Outlook
The speed with which US equities have recovered their sharp Liberation Day losses has broken records. Risk-on sentiment has returned as a result of falling uncertainty, robust macroeconomic data and positive earnings prints from several of the multi-trillion-dollar behemoths that sit atop US indices.
Despite this rally, however, something is clearly afoot across financial markets. As above, the dollar has had its worst first half in more than 50 years, South Korea is the best performing equity market in 2025 thus far and the gold price has risen by more than a quarter.
Long-dated bonds have sold off around the world as the fiscal taps remain jammed on (Germany has abandoned the world’s strictest set of fiscal rules with the release of the ‘debt brake’ to finance a huge programme of fiscal expansion with no appreciable means by which to reduce deficits anywhere).
In our view, uncertainty and volatility are defining characteristics of this new regime, so despite better sentiment around trade relations and economic growth, the outlook remains difficult to predict.
Yet we continue to believe that our differentiated approach is well suited to this new regime. We see plenty of attractive value and income across bonds and equities and believe the fund is well equipped to keep on delivering an attractive income and total return proposition for our investors.