Artemis SmartGARP Global Emerging Markets Equity Fund update
Raheel Altaf, manager of the Artemis SmartGARP Global Emerging Markets Equity Fund, reports on the fund over the quarter to 30 June 2025.
Source for all information: Artemis as at 30 June 2025, unless otherwise stated.
Performance
- Q2 relative performance +0.2 percentage points. The fund made 5.7% compared with 5.5% from its MSCI Emerging Markets benchmark (in GBP)
- The fund has delivered consistent outperformance and is the best performer in its IA Global Emerging Markets sector over five and 10 years
| Three months | Six months | One year | Three years | Five years | |
|---|---|---|---|---|---|
| Artemis SmartGARP Global Emerging Markets Equity | 5.7% | 7.1% | 5.5% | 41.7% | 71.0% |
| MSCI Emerging Markets NR | 5.5% | 5.3% | 6.3% | 17.0% | 25.3% |
| IA Global Emerging Markets Average | 5.9% | 4.4% | 4.7% | 17.4% | 26.7% |
Summary
- A weaker dollar, benign economic environment and rotation away from the US provide a catalyst for emerging markets
- Emerging market stocks remain cheap and unloved, with abundant growth and income opportunities
- The value bias in the fund remains substantial, with a 30% discount to the MSCI Emerging Markets index, but the portfolio also has more favourable quality and growth characteristics than its benchmark
- Read our latest on tariffs here: Two books to help you make sense of the US/China trade war
- Learn more about SmartGARP and the team here: Artemis SmartGARP in Five
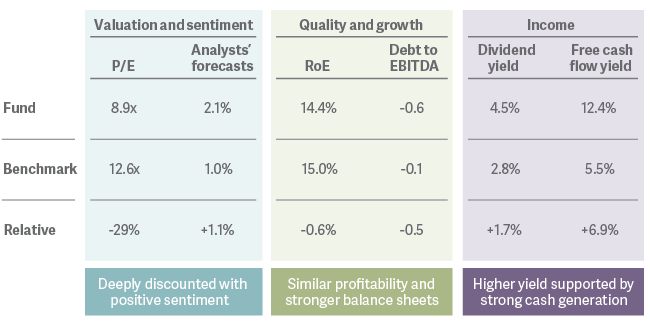
If the fund were a stock
Key fund characteristics
Attribution – favourable tailwinds for our holdings
Many of our peers have chosen to avoid China, with some deeming it to be uninvestable. We disagree. We have no particular edge with calling the direction of markets. However, we have become convinced that the risk/reward trade-off in some companies in China is the best among all global stock markets, while balance sheets also look healthy. Although our enthusiasm for the market proved to be a headwind from an asset allocation perspective, our stockpicking has more than compensated for the risks taken in the past few years. Sino Biopharmaceutical, People’s Insurance Company of China (PICC) and CMOC all featured among our top contributors this quarter.
Elsewhere, our stock selection in India continues to perform well. Telecoms infrastructure giant Indus Towers and software developer Redington both rose significantly in the period. These were offset by weakness in consumer names, with auto manufacturers proving volatile against a backdrop of tariff threats. Our lighter weighting to semiconductors also hindered relative performance, as tech stocks bounced strongly in the V-shaped recovery.
Activity – adding to China consumption, Latin America and Samsung
Korean stocks have experienced strong returns this year. A period of political calm and favourable shareholder policies have been supportive. We hold around 12% of our fund in Korean stocks trading at or below book value. We think that as sentiment improves, these stand to perform well.
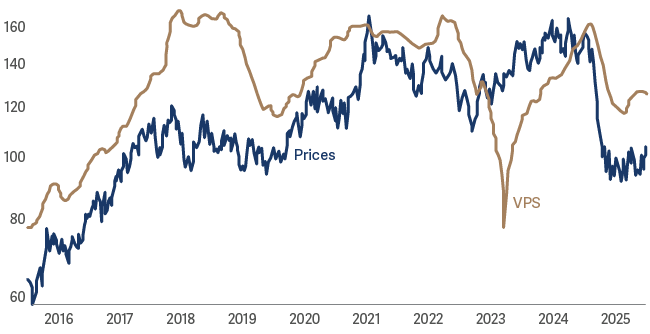
We added Samsung in early April and have built the position to an overweight stance against the index since then. The memory cycle appears to be bottoming out and the shares trade below book value. The share price stabilisation and a recovery of fundamentals provide a good backdrop for better returns ahead. A reminder that the fundamental value per share we track combines earnings, cashflows, operating profits, dividends and assets.
Samsung Electronics Co. Ltd. vs MXEF Index as at 08/07/2025
In the past few months, we have been adding to consumption plays in China. Pessimism has reached extreme levels and with low investor positioning, we felt the risk/reward trade-off had become extremely favourable. There remains a clear disconnect between share prices and the financial performance of businesses. During the quarter, we increased our positions in base and rare metals miner CMOC, telecoms infrastructure company China Tower and pharmaceutical Sino Biopharm.
Elsewhere, we boosted our exposure to Latin America. The region benefits from a weaker dollar and a benign geopolitical position. Among financials we added Banco Bradesco and PagSeguro in Brazil and increased our stakes in Peru's Credicorp and Chile's Banco Santander. We also bought Copa Airlines, which boasts the highest profit margins of any airline stock in the world.
The result of these changes is that the fund continues to offer an attractive combination of extremely low valuations and attractive growth prospects. Alongside our China overweight, in aggregate we remain overweight Brazil, Korea and UAE and underweight India, Taiwan and Saudi Arabia. At the sector level, financials, consumer discretionary and industrials feature as the largest overweights. Technology and consumer staples are the largest underweights.
We remain heavily biased towards value stocks
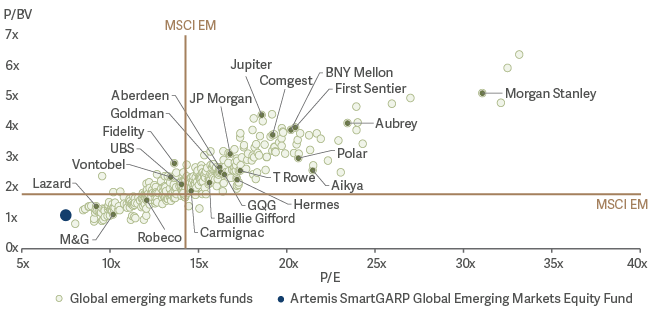
The fund offers a forward P/E of 8.9 vs 12.6 for the index (a 29% discount). We think our discipline around valuations is likely to be a rewarding strategy for the years ahead. While value stocks in emerging markets have recovered from depressed levels in recent years, the gap in valuations between cheap and expensive stocks remains stretched. This suggests that the opportunity remains.
Typically, significant exposure to value stocks coincides with distressed balance sheets and volatile earnings. This doesn’t appear to be evident today and the fund offers favourable quality and growth characteristics. Although value stocks in emerging markets have performed well in the past few years, active managers are still biased towards higher growth areas and have been slow to shift away. We offer a differentiation that could be helpful in a broader portfolio mix.
Artemis Global Emerging Markets: Deep value with good growth
Emerging market pessimism well reflected in prices, weakness in US could see capital allocation shift to cheaper markets
The Chinese economic recovery has so far been underwhelming, not least due to geopolitical uncertainty. On the positive side, the potential for stimulus measures to offset a weaker growth outlook could be significant.
Emerging market stocks in general remain lowly valued and out of favour. This gives them some downside protection compared with markets that have performed exceptionally well and where growth has been extrapolated far into the future, such as the US.
In the shorter term, any weakness in sentiment is likely to lead to selling pressure. Rather than becoming more pessimistic in these periods, we think a contrarian approach of allocating to emerging markets will be a rewarding strategy. When times are bad, indiscriminate selling creates opportunities for disciplined investors and our process has been designed to look for companies where the fundamentals are signalling good news, yet share prices are not reflecting this optimism.
Catalysts for a recovery in emerging markets appear to be on the horizon. China remains in stimulus mode, while fiscal easing across a number of markets provides further liquidity. The potential for monetary easing could also be supportive of economic growth. A weaker dollar eases funding risks and boosts corporate profits.
Emerging markets also offer diversification against US-centric risks. We could be in the early stages of seeing a shift in purchasing power away from the West and towards the East. In our view, these factors make emerging markets very hard to ignore.
In the past six months, markets have experienced some turbulence, yet also enjoyed a strong recovery. The key lesson here is to invest in undervalued assets, reinvest during drawdowns and let profits and dividends do their work. Tariffs may weigh on trade, but inflation is benign and interest rates are likely to be stable. The main risk is earnings faltering, but SmartGARP has already tilted us toward more resilient, lower-risk holdings. So, despite market noise, our positioning looks well judged.