Why credit spreads aren’t as tight as they seem
While credit spreads look superficially tight today compared with their widest ever levels, Stephen Snowden says there is more to this metric than meets the eye.
UK investors sold down a net £1.24bn of bond fund holdings in April, the second-worst month on record, even though net equity flows remained steady at £1.51bn1.
We would guess that a significant chunk of those outflows came from corporate bond funds, with tight spreads among clients’ chief concerns.
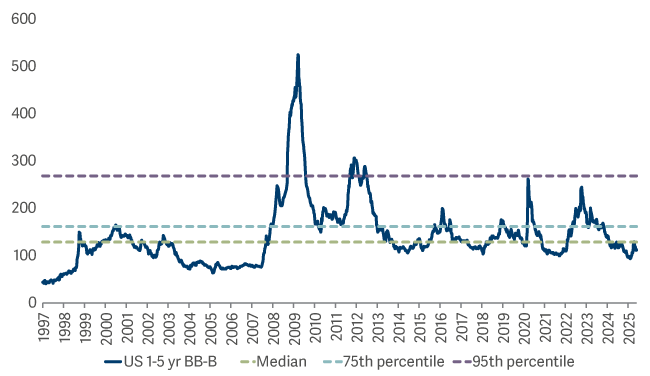
To be fair, credit spreads do look superficially tight today compared with their widest ever levels2. But when looking at a historical chart of this measure, what is noticeable apart from the height of these peaks is their brevity – the amount of time spent at these extremes is miniscule3.
So while credit spreads aren’t currently in a ‘cheap’ percentile, they are not so far away from their median.
A history of short-dated high yield spreads
When credit risk is less risky
We would also argue that the past 25 years may not be the best timeframe over which to assess what constitutes a ‘cheap’ credit spread.
Conditions have changed dramatically over this time, as shown by consumer, corporate and government debt.
Debt to income - UK
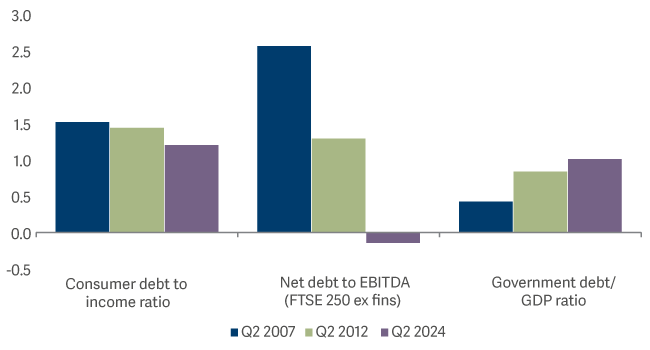
UK consumers have continued to pay down debt ever since the Global Financial Crisis. The average UK consumer is much more creditworthy today than they were two decades ago and the same holds true for those in the US and Germany4.
It is a similar story for corporates, with leverage down substantially (again, the same trend can be observed internationally).
Government balance sheets are the odd ones out. Governments borrowed heavily to support their economies through the Global Financial Crisis, but even as conditions improved, they made little progress in paying down debt.
Then Covid hit, leading to another massive wave of government spending during multiple lockdowns. Again, little to no progress has been made in reducing our reliance on government borrowing since then.
This means that while the risk of lending to people or companies is at its lowest for a generation, the risk of lending to a government is close to its highest. Therefore, it is no wonder that the credit spread – the difference between the two – is so tight.
Buying gilts or other government bonds is regarded as a ‘risk free’ investment. And while I’m not saying that the risk-free element has disappeared, it is unquestionably less ‘risk-free’ than it was.
What determines a corporate bond yield?
To state the obvious, a corporate bond yield is:
The risk-free rate (as offered by a gilt) + the credit spread (the additional risk of lending to people and companies).
Today, we have established that:
- Credit spreads are close to their average
- The risk-free rate is more risky than average
- The additional risk is less risky than average
Therefore, we would argue that corporate bonds are cheap, not expensive. Looking at this issue from a purely statistical or academic perspective, credit spreads should be the tightest they’ve ever been.
We are all entitled to our view of where valuations should be, but that will always be subjective.
What we can’t quibble with are actual returns. Let us look at the past 10 years. Despite credit spreads being essentially unchanged over this time, corporate bonds have dramatically outperformed gilts. Yes, it has been a more volatile journey, but the compounding of the extra income over time is a powerful force.
Total returns % over the last 10 years
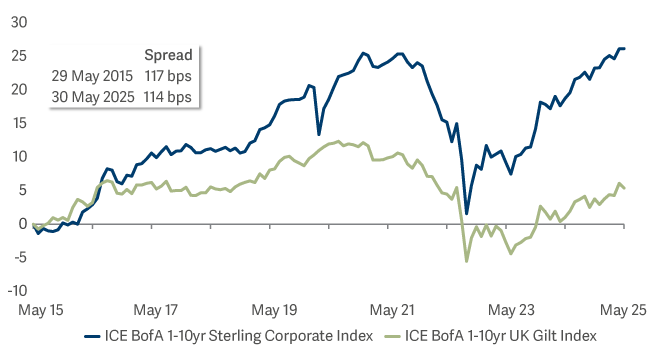
Like all statistics, the date range can be manipulated. If we take the worst possible starting point for corporate bonds compared with gilts over the past 25 years, June 2007, it took about six years for the former asset class to catch up with the latter, which sounds like a long time5.
However, it took nearly 10 years for equities to do the same. In addition, we are seeing what we’d hope to see – you get rewarded for taking on more risk over the long term, even if you pick the worst possible starting point.
The simple truth is this: compounding the higher yield from corporate bonds over time delivers much higher returns than you would expect to see from government bonds.
The trouble with timing the bond market
Timing your entry into the corporate bond market at the point when spreads are at their widest would no doubt see you handsomely rewarded, so long as you don’t count the lost yield from the multi-year periods when you are sitting on the sidelines: one mathematical certainty is that few investors will be able to out-time compounding interest.
The inconvenient truth
Market timing is more common in equity markets – perhaps that’s why fund flows into the asset class were so high during the volatility of April. But remember, there is a high correlation between credit spreads and equity markets, meaning that if you’re selling your corporate bonds on valuation concerns, you should be selling your equity holdings first.
2https://tradingeconomics.com/
3Bloomberg to 31/05/2025
4https://tradingeconomics.com/
5Bloomberg to 31/05/2025