Artemis SmartGARP UK Equity Fund update
Philip Wolstencroft, manager of the Artemis SmartGARP UK Equity Fund, reports on the fund over the quarter to 31 March 2025.
Source for all information: Artemis as at 31 March 2025, unless otherwise stated.
Overview
The fund largely tracked the FTSE All-Share during the first quarter – up 3.9% compared with 4.5% from the index. It is comfortably ahead of the competition over the past one, three and five years, as well as since inception.
| Three months | One year | Three years | Five years | |
|---|---|---|---|---|
| Artemis SmartGARP UK Equity Fund | 3.9% | 17.3% | 43.8% | 155.2% |
| FTSE All-Share TR | 4.5% | 10.5% | 23.3% | 76.5% |
| IA UK All Companies Average | 0.1% | 4.9% | 10.4% | 60.5% |
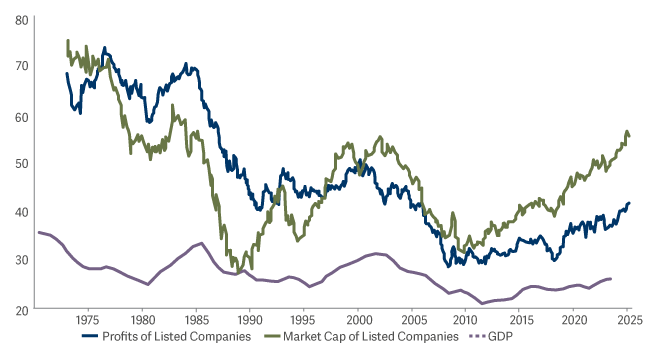
The dominant theme during the quarter was the US government attempting to pick a fight with pretty much everyone outside of the US. US equities need global co-operation (on rules, taxes and so on), but tariffs make this less likely. Commentary tends to focus on winners and losers from tariffs, when in reality, the chart below illustrates who the real loser is likely to be – anyone who invests in US equities.
The US as a percentage of the world

The underperformance of US equities in a global context is barely visible in the chart above. Buyer beware!
Contributors
The fund benefited from value stocks doing well, although in a quarter when performance was largely in line with the index, there is a struggle to write an interesting note (see my quarterly report for the Artemis SmartGARP European Equity Fund for some stronger views). We can point to wins in Coca-Cola Hellenic Bottling and AngloGold Ashanti (we kept the shares after it took over our gold producer Centamin).
Five of our top performers were banks, which continue to benefit from higher interest rates.
From a relative point of view, avoiding Diageo and Glencore contributed to performance as these stocks fell.
Detractors
The fund took a hit as British Airways parent company IAG fell sharply, with rumours that recent actions by the US government have contributed to a drop in bookings. This is probably just noise though and the long-term prospects look good.
Trainline fell after the UK government announced plans to launch a rival service that would bring together every national train operator, challenging the company's dominance in ticketing.
From a relative point of view, we suffered from our below-benchmark position in HSBC and avoidance of BAE Systems, which both did well.
Activity
We made numerous changes within our non-UK exposure (up to 20% of our holdings can be listed abroad) during the period. Norwegian oil & gas company Equinor was our biggest new position, while we sold out of Teva Pharmaceuticals (Israel) on poor earnings.
We also switched out of UniCredit and into Societe Generale. Banks remain attractive to us as they trade at discounted valuations while experiencing superior fundamental growth. We noticed that, after three years of outperforming a sector that itself had been outperforming the broader market, UniCredit has recently started to perform in line with its peers. Conversely, the fundamentals have turned in favour of Societe Generale after a fairly sustained period of underperformance, with its share price now trading at a discount to the sector. It therefore seemed to be a more attractive opportunity relative to UniCredit, which informed our capital-allocation decision.
In our UK holdings, we initiated new positions in banks HSBC and Lloyds, and added to Marks & Spencer, which fell after competitor Asda started a price war. We took some profits from Rolls-Royce on the back of strong performance.
Outlook
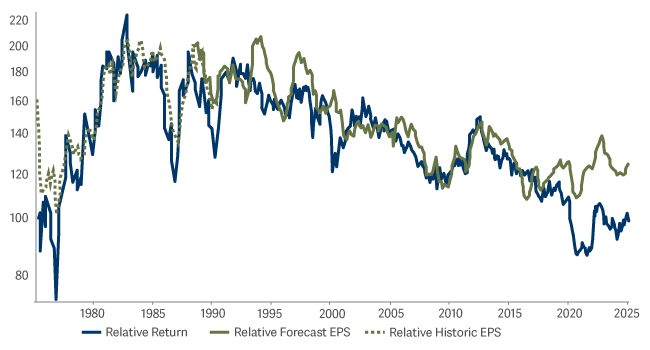
Being one of the world's lowliest-valued markets when the US is doing its best to shoot itself in the foot ought to make this a good time for UK equities. However, there has not been much good news at home and so the domestic market has trailed the rest of Europe.
As the chart below illustrates, UK equities are cheaper than the rest of Europe (blue line below green) while EPS (earnings per share) momentum is not bad (green line flat to rising). As such we would be reasonably optimistic on the UK market.
MSCI UK Vs MSCI Europe Ex UK

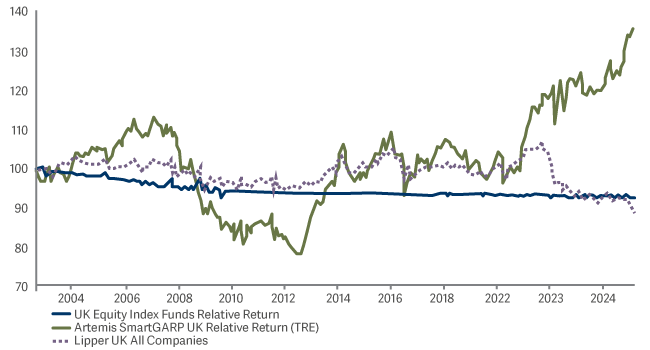
Until a few years ago, we looked like a more volatile version of an average active fund. However, the past couple of years have seen a big gap open up. Of course, we would put this down to sticking to our knitting whilst others were chasing price momentum rather than profit momentum.
Fund vs peers and index

As you would expect, we remain positive on our funds – not because we think they have good price momentum but because we focus on doing simple things well.

