Artemis Funds (Lux) – SmartGARP Global Emerging Markets Equity update
The managers report on the fund over the quarter to 30 June 2023 and the outlook.
Summary
- Q2 relative return +3.1%. Fund +4.0 % vs index +0.9% (in US dollar terms)
- Performance in top quartile vs IA sector for 1,3,5 years and since inception
- Value bias in the fund remains substantial, 48% discount to the market…
- …with a history of delivering good growth.
Performance – significant outperformance in a volatile quarter
The promise of emerging markets has yet to materialise this year. In the last quarter, emerging market stocks rose 1% but underperformed developed markets. Yet this masks significant divergences at the country and sector level. Stocks in Eastern European markets, such as Poland and Hungary were up more than 20%, while those in Turkey are down around 15%. Brazilian stocks were up 14%, while those in China were down 10%. Dispersion remains at fairly high levels in EM and this has created a backdrop that has been well suited to our active stock picking approach. We outperformed the market by 4.6% in the quarter.
Stock picking opportunities in China
Following on from a sharp rally at the back end of last year, the Chinese market has lost steam recently with worries around geopolitics and contagion from growth risks in western economies. Manufacturing activity has now contracted for three consecutive months.
Despite this challenging backdrop, opportunities for stock picking have been aplenty. Our holdings in PICC (insurance), Foxconn Industrial Internet (communications equipment) and Sinotrans (air freight and logistics) delivered strong performance against a weaker market backdrop. Having no exposure to Tencent also proved helpful to relative performance as the shares dropped 15% in the period.
Brazil exposure contributed positively
While the headlines are still dominated by China, positive trends are evident in areas outside of the world’s second-largest economy. Brazil is one such area. As an agricultural heavyweight, supplying soya beans, beef, coffee and sugar (amongst others) to many parts of the world, its economy is thriving. Brazil is at the end of its monetary tightening cycle. Its inflation is lower than in many parts of Europe and the country has an abundance of energy and commodities.
For shareholders, substantial dividends are on offer, with good growth and attractive valuations. Banco do Brasil and Petrobras are examples that both featured as top contributors to the fund in the last quarter.
Additions to the fund – improving fundamental trends
- Asia recovery – Novatek (semiconductors), LG Electronics (displays) and Kia (autos)
- India – Indus Towers (infrastructure)
- Good Q1 results – Indofoods (noodles) and ENN Natural Gas (utilities)
Reductions - deteriorating fundamentals
- China optimism fades – Muyuan, Gree Electric and NetDragon
As we head into July, our style characteristics are unchanged from the start of the year. Our largest overweight positions remain in China, Brazil and Turkey while our largest underweights are in India, Taiwan and Saudi Arabia. At the sector level our preference for energy, financials, industrials and food and beverages remains, whilst we continue to have less exposure to technology, materials and media and entertainment.
Value bias remains substantial
We have commented for years about our gradual transition towards value parts of the market as a result of their attractive characteristics. Despite the outperformance of value stocks over their growth counterparts in the last year, the fund's valuation discount to the market has not changed much. The fund continues to offer an attractive combination of extremely low valuations and attractive growth prospects. The price/book ratio of the fund is 0.9 and it offers a forward P/E of 6.4 vs 12.2 for the index (48% discount).
The gap in valuations between cheap and expensive stocks remains at extremely high levels compared to history. We see this across a range of metrics we look at. Earnings, cash flows, dividends, book values and operating profits. This suggests that value stocks are unusually cheap. They have been for some time now.
Historically, large valuation discounts have provided some margin of safety, which has proved to be protective through more challenging and volatile market conditions. We think our discipline around valuations is likely to be a rewarding strategy as we progress through the second half of 2023 and for the years ahead.
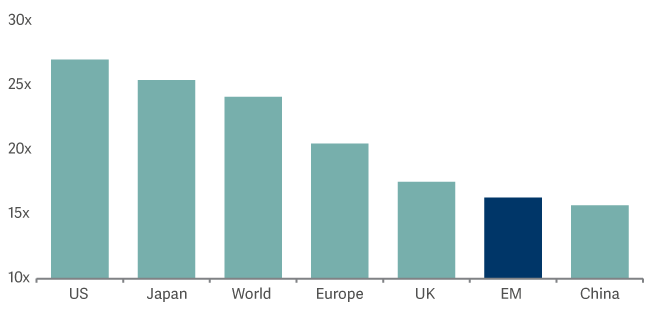
Outlook – EM equities remain cheap and unloved
Whilst EM stocks have lagged their developed counterparts this year, valuations continue to offer some support for those willing to look through volatility. The chart below shows the cyclically adjusted PE for various markets and emerging stocks standout as being the cheapest.
Shiller PE by region
Improving fundamentals to provide further tailwinds
We continue to see positive trends in the fundamental value per share of our holdings relative to the market. In the last three years, our holdings have outgrown the market’s fundamentals by 10% per annum. The fundamental value per share we construct tracks cash flows, dividends, operating profits and asset values for our companies and the broader market. Despite this superior growth, the gap between fundamentals and share prices of our holdings remains substantial. The potential for catch up presents an opportunity.
Source: Lipper Limited/Artemis from 31 March 2023 to 30 June 2023 for class I Acc USD
All figures show total returns with dividends and/or income reinvested, net of all charges.
Performance does not take account of any costs incurred when investors buy or sell the fund.
Returns may vary as a result of currency fluctuations if the investor's currency is different to that of the class.
Benchmark: MSCI Emerging Markets Index; the benchmark is a point of reference against which the performance of the fund may be measured. Management of the fund is not restricted by this benchmark. The deviation from the benchmark may be significant and the portfolio of the fund may at times bear little or no resemblance to its benchmark.